RSS

渥太华房价【红宝地产】2023.10月房市数据报告

渥太华十月份房屋销售呈现典型的冷淡态势

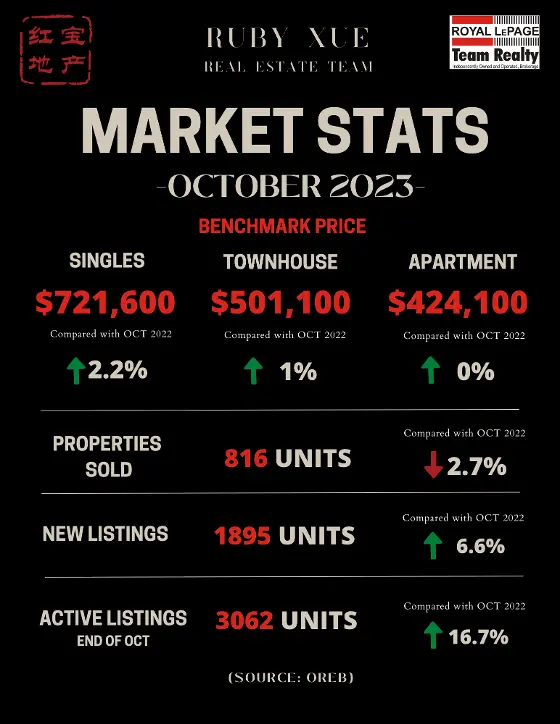
2023年10月,通过渥太华房地产局系统售出的房屋数量为816套。与2022年10月相比,略微减少了2.7%。

10月份的房屋销量比5年平均水平低36.4%,比10年平均水平低30.8%。

今年前 10 个月的房屋销售量为 10,700 套,同比大幅下降 12.4%。与 2022 年同期相比,大幅下降了 12.3%。

"OREB总裁肯-德克尔(Ken Dekker)说:"如今生活成本高昂,这很可能导致买家和卖家都按兵不动。"我们看到销售活动正在缓慢下降,但降幅很小,在每年的这个时候并不出人意料。价格正在调整和下降,这也表明了正在销售的房屋类型--公寓的销售活动比去年 10 月增长最多。虽然渥太华的库存量在缓慢增加,但长期的供应问题意味着需求始终存在。不要被眼前的冷清所迷惑:现在是买家寻找机会的最佳时机,以免被大流从平衡市场带入卖家领地。

价格:MLS® 房价指数 (HPI) 比平均价格或中位价格更准确地追踪价格趋势。

2023 年 10 月,MLS® HPI 综合基准价格为 63.86 万加币,几乎没有变化,与 2022 年 10 月相比仅上涨了 1.8%。
独户住宅的基准价格为72.16万加币,9月份同比上涨2.2%。
相比之下,联排别墅的基准价格为 50.11 万加币,几乎没有变化,与去年同期相比上涨了 1%。
公寓的基准价格为 42.41 万加币,与去年同期水平持平。
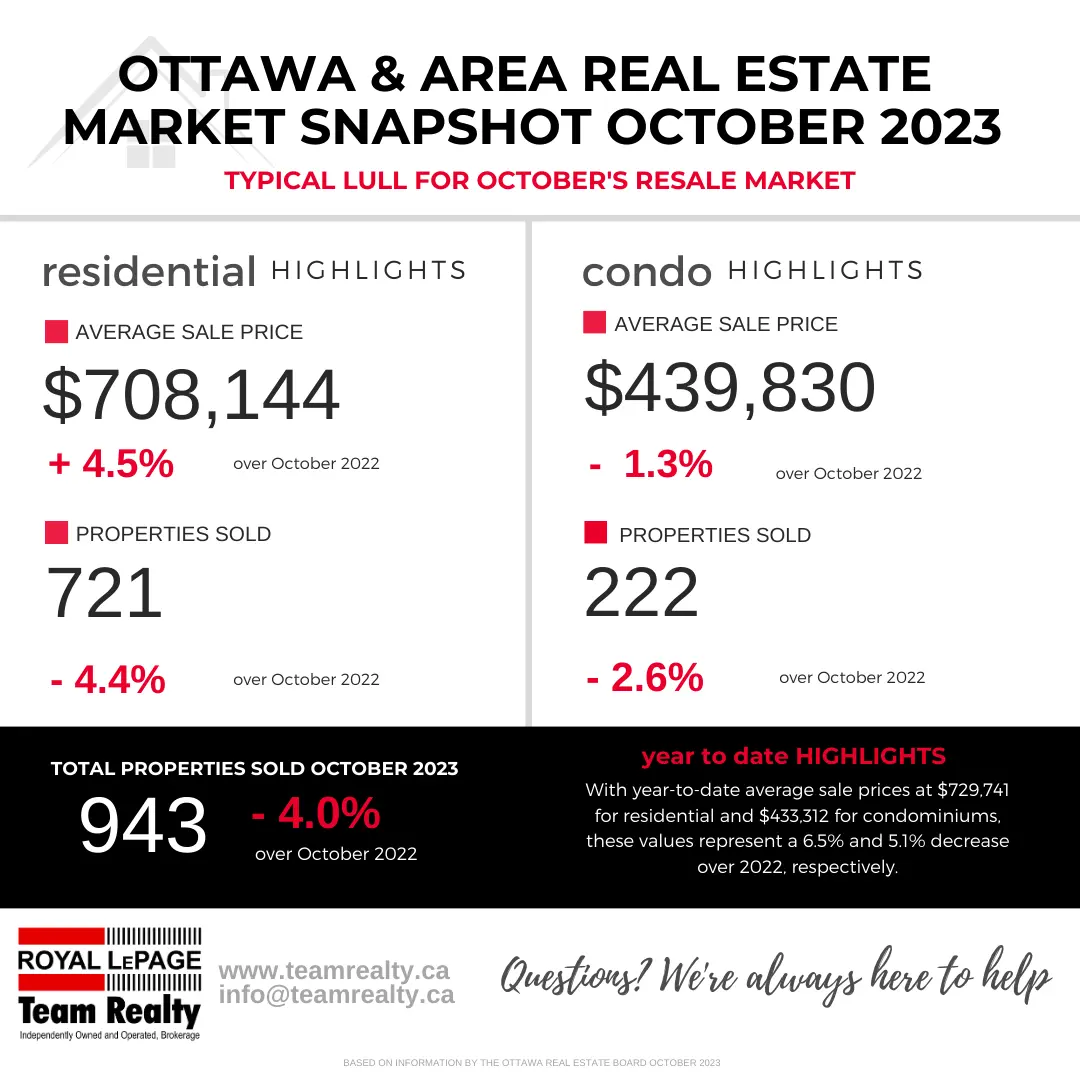
2023 年 10 月售出的住宅均价为 660,836 加币,比 2022 年 10 月上涨了 2.9%。今年迄今为止的综合平均价格为 671,983 加币,与 2022 年前十个月相比下降了 5.9%。
2023 年 10 月的所有房屋销售金额为 5.392 亿加币,与 2022 年同期持平。
OREB 提醒说,平均销售价格有助于确定一段时间内的趋势,但不应被用作特定房产升值或贬值的指标。平均售价是根据所有售出房产的总金额计算得出的。不同社区的价格会有所不同。                 

库存和新挂牌房源:

新挂牌房源数量比 2022 年 10 月增加了 6.6%。2023 年 10 月共有 1,895套新住宅挂牌。10月份的新挂牌量比五年平均水平高出 2%,比十年平均水平高出 5.4%。
截至 10 月底,市场上的活跃住宅挂牌量为 3,062套,与 2022 年 10 月底相比大幅增长了 16.7%。五年多来,10 月份的活跃挂牌量从未如此之高。
10月份的活跃房源比 5 年平均水平高出 43.8%,比10年平均水平低 10.9%。
2023年10月底的库存月数为3.8个月,略高于2022年10月底的3.1个月。库存月数是指以目前的销售活动速度出售当前库存所需的月数。

(来源:渥太华地产局)

Read

Ottawa Real Estate - October Stats (2023)

Ottawa MLS® October Home Sales Show Typical Lull

The number of homes sold through the MLS® System of the Ottawa Real Estate Board totaled 816 units in October 2023. This was a small reduction of 2.7% from October 2022.

Home sales were 36.4% below the five-year average and 30.8% below the 10-year average for the month of October.

On a year-to-date basis, home sales totaled 10,700 units over the first 10 months of the year. This was a substantial decline of 12.3% from the same period in 2022.

“Life is expensive these days, which likely has both buyers and sellers staying put,” says Ken Dekker, OREB President. “We’re seeing a slow decline in sales activity but it’s minimal and not unexpected for this time of year. Prices are adjusting and coming down, which is also indicative of the types of homes that are selling — apartments seeing the largest increase in sales activity over last October. While Ottawa’s inventory is slowly building, chronic supply issues mean there’s always an undercurrent of demand. Don’t let the lull fool you: now is a prime time for buyers to be looking for opportunities before the current carries us from a balanced market into seller’s territory.”

By the Numbers – Prices:

The MLS® Home Price Index (HPI) tracks price trends far more accurately than is possible using average or median price measures.

  • The overall MLS® HPI composite benchmark price was $638,600 in October 2023, nearly unchanged, up only 1.8% from October 2022.

    1. The benchmark price for single-family homes was $721,600, up 2.2% on a year-over-year basis in September.

    2. By comparison, the benchmark price for a townhouse was $501,100, nearly unchanged, up 1% compared to a year earlier.

    3. The benchmark apartment price was $424,100, unchanged from year-ago levels.

  • The average price of homes sold in October 2023 was $660,836, increasing 2.9% from October 2022. The more comprehensive year-to-date average price was $671,983, a decline of 5.9% from the first ten months of 2022.

  • The dollar value of all home sales in October 2023 was $539.2 million, unchanged from the same month in 2022.

OREB cautions that the average sale price can be useful in establishing trends over time but should not be used as an indicator that specific properties have increased or decreased in value. The calculation of the average sale price is based on the total dollar volume of all properties sold. Price will vary from neighbourhood to neighbourhood.

By the Numbers – Inventory & New Listings:

  • The number of new listings saw an increase of 6.6% from October 2022. There were 1,895 new residential listings in October 2023. New listings were 2% above the five-year average and 5.4% above the 10-year average for the month of October.

  • Active residential listings numbered 3,062 units on the market at the end of October, a sizable gain of 16.7% from the end of October 2022. Active listings haven’t been this high in the month of October in more than five years. 

  • Active listings were 43.8% above the five-year average and 10.9% below the 10-year average for the month of October.

  • Months of inventory numbered 3.8 at the end of October 2023, just up from the 3.1 months recorded at the end of October 2022. The number of months of inventory is the number of months it would take to sell current inventories at the current rate of sales activity.

(SOURCE: OREB)

Read

Ottawa Real Estate - September Stats (2023)

Ottawa MLS® Home Sales Hold Steady in Lackluster September

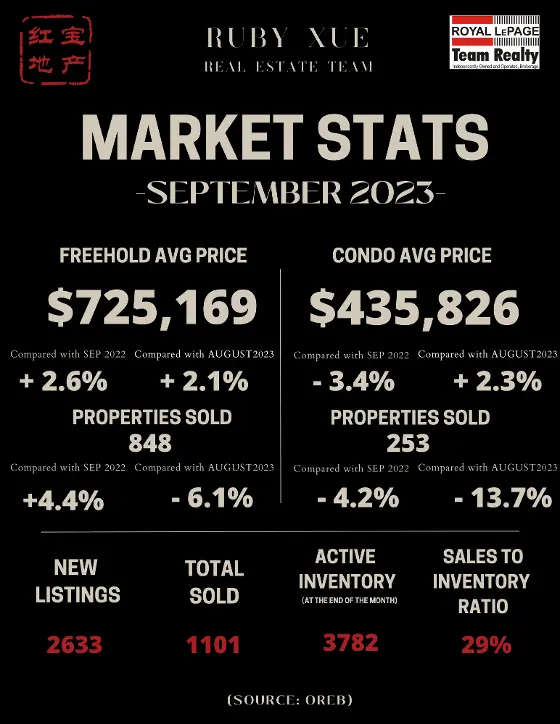
The number of homes sold through the MLS® System of the Ottawa Real Estate Board (OREB) totaled 946 units in September 2023. This was unchanged from September 2022.

Home sales were 29.6% below the five-year average and 23.6% below the 10-year average for the month of September.

On a year-to-date basis, home sales totaled 9,889 units over the first nine months of the year. This was a large decline of 13% from the same period in 2022.

“Sales activity came in right on par with where it stood at the same time last year but was still running well below typical levels for a September,” said Ken Dekker, OREB President. “New listings have surged in the past several months, which has caused overall inventories to begin gradually rising again. However, available supply is still low by historical standards, and we have ample room to absorb more listings coming on the market. Our market is also right in the middle of balanced territory, and while MLS® Benchmark prices are down from last year they are still trending at about the same levels from 2021.”

By the Numbers – Prices:
The MLS® Home Price Index (HPI) tracks price trends far more accurately than is possible using average or median price measures.

  • The overall MLS® HPI composite benchmark price was $643,600 in September 2023, nearly unchanged, up only 0.5% compared to September 2022.

    • The benchmark price for single-family homes was $727,500, essentially unchanged, up just 0.6% on a year-over-year basis in September.

    • By comparison, the benchmark price for townhouse/row units was $510,900, a small gain of 2.5% compared to a year earlier, while the benchmark apartment price was $422,300, falling by 1.1% from year-ago levels.

  • The average price of homes sold in September 2023 was $675,412, increasing by 2.7% from September 2022. The more comprehensive year-to-date average price was $672,837, a decline of 6.5% from the first nine months of 2022.

  • The dollar value of all home sales in September 2023 was $638.9 million, up modestly by 2.7% from the same month in 2022.

OREB cautions that the average sale price can be useful in establishing trends over time but should not be used as an indicator that specific properties have increased or decreased in value. The calculation of the average sale price is based on the total dollar volume of all properties sold. Price will vary from neighbourhood to neighbourhood.

By the Numbers – Inventory & New Listings

  • The number of new listings saw an increase of 9.8% from September 2022. There were 2,259 new residential listings in September 2023. New listings were 4.8% above the five-year average and 7% above the 10-year average for the month of September.

  • Active residential listings numbered 2,997 units on the market at the end of September, a sizable gain of 14% from the end of September 2022. Active listings haven’t been this high in the month of September in five years.

  • Active listings were 33.9% above the five-year average and 18.5% below the 10-year average for the month of September.

  • Months of inventory numbered 3.2 at the end of September 2023, up from the 2.8 months recorded at the end of September 2022 and below the long-run average of 3.3 months for this time of year. The number of months of inventory is the number of months it would take to sell current inventories at the current rate of sales activity.

(SOURCE: OREB)

Read

渥太华房价【红宝地产】2023.8月房市数据报告


【渥太华房产8月报告】10次加息,重创体现,年度单月房价下滑最严重. 房价跌,租金涨,无论房东还是房客都逃离不了经济萎缩的漩涡.

市场下调时期,自住买家上车好时期,可以任挑任选. 卖家如果持有浮动利率,要好好衡量一下自己未来1-2年的经济情况,如果继续持有造成生活上的压力,可以果断卖掉,毕竟东山还会再起,量力而行才是明智的.

庆幸的是,经过一年半的浮浮沉沉,市场均价还在去年同期水平,像马桶里的皮球一样,按下去还是会浮上来. 只是目前的借贷成本太高,不宜消费. 目前市场只要借贷任何种类都没有正的现金流,如果出手就是要确定以后的capital gain能大于普遍市场的,这个需要些眼光和功力.

如果你想在逆市中需找机会,欢迎联系渥太华优秀的地产经纪团队,红宝地产.

Read

Ottawa Real Estate - August Stats (2023)

Ottawa Resale Market Stalls in August, Supply Challenges Persist

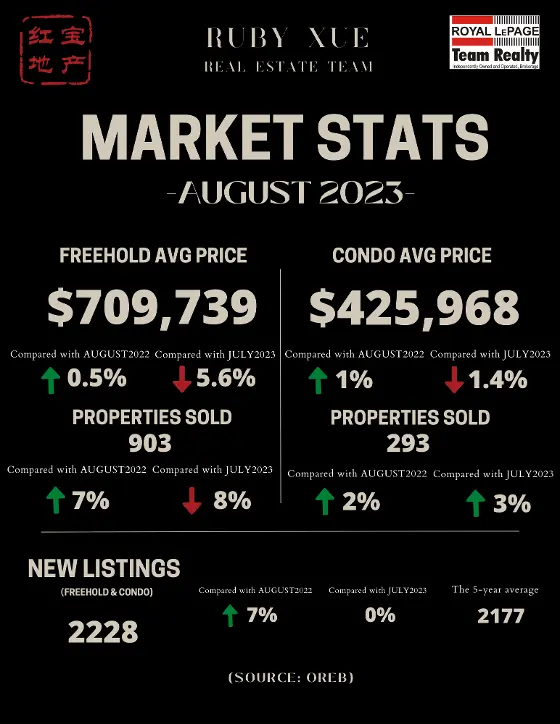
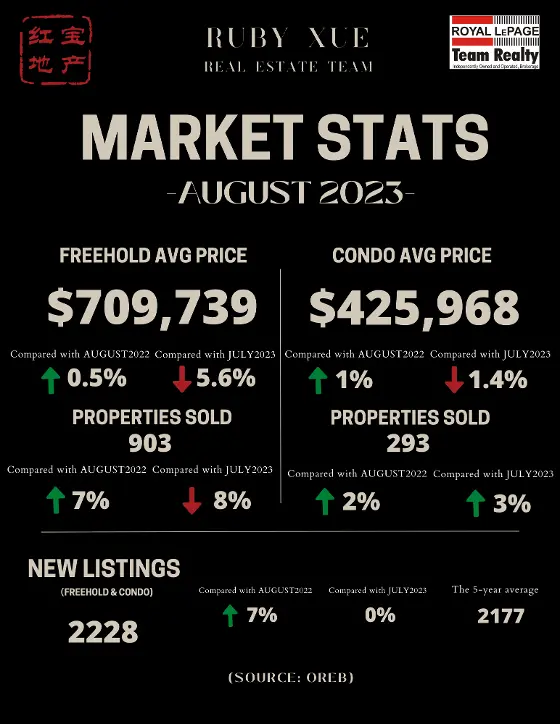
Members of the Ottawa Real Estate Board (OREB) sold 1,196 residential properties in August through the Board’s Multiple Listing Service® (MLS®) System, compared with 1,130 in August 2022, an increase of 6%. August’s sales included 903 in the freehold-property class, up 7% from a year ago, and 293 in the condominium-property category, a 2% increase from August 2022. The five-year average for total unit sales in August is 1,525.

“Sales activity was up marginally on a year-over-year basis in August but remained well below the historical average for this time of year,” says Ken Dekker, OREB President. “There is no shortage of demand given increased immigration and the large Canadian population cohort entering the market. The lack of suitable, affordable housing is a hindrance. High borrowing costs and economic uncertainty are impacting both sellers and buyers, which we expect will continue to result in further market fluctuations.”

Janice Myers, OREB CEO, highlights that these latest figures coincide with the City of Ottawa’s allocation of $110 million for affordable housing. “Even if interest rates were to drop and the economy stabilized, housing will remain out of reach for many Ottawa residents. Collaboration among all levels of government and stakeholders is vital to improving affordability for homeowners and tenants alike. And we need to expand provincial regulations, allowing four or more residential dwelling units on serviced lots, to promote higher-density housing.”

By the Numbers

Average Prices*:

  • The average sale price for a freehold-class property in August was $709,739, an increase of 0.5% from 2022, and a 5.6% decrease over July 2023 prices.

  • The average sale price for a condominium-class property was $425,968 an increase of 1% from a year ago, although 1.4% lower than July 2023 prices.

  • With year-to-date average sale prices at $732,220 for freeholds and $432,571 for condos, these values represent an 8% decrease over 2022 for freehold-class properties and a 5.5% decrease for condominium-class properties.


Inventory & New Listings:

  • August’s new listings (2,228) increased 7% over August 2022 (2,090) and were on par with last month (2,234). The 5-year average for new listings in August is 2,177.

  • Months of Inventory for the freehold-class properties has increased to 3 months from 2.9 months in August 2022 and 2.7 months in July 2023.

  • Months of Inventory for condominium-class properties remains on par with August 2022 at 2.2 months, a slight decrease from 2.3 months in July 2023.

  • Days on market (DOM) for freeholds have increased to 31 days from 25 days in August 2022 and 26 days in July 2023.

  • Days on market (DOM) for condos have increased to 29 days from 28 days in August 2022 and 28 days in July 2023.


REALTORS® also help with finding rentals and vetting potential tenants. Since the beginning of the year, OREB Members have assisted clients with renting 4,571 properties compared to 4,172 last year at this time, an increase of 10%.

* OREB cautions that the average sale price can be useful in establishing trends over time but should not be used as an indicator that specific properties have increased or decreased in value. The calculation of the average sale price is based on the total dollar volume of all properties sold. Price will vary from neighbourhood to neighbourhood.

(Source: OREB)

Read

Ottawa Real Estate - July Stats (2023)

Stabilized July Resale Market Showing Positive Price Gains

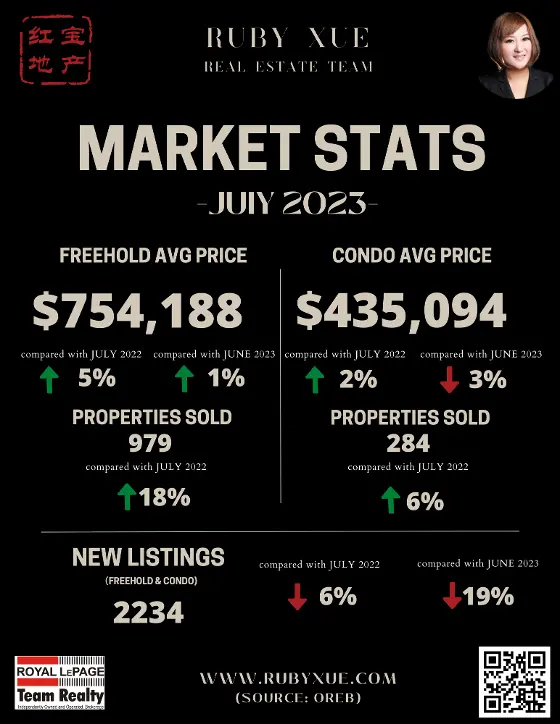
Members of the Ottawa Real Estate Board (OREB) sold 1,263 residential properties in July through the Board’s Multiple Listing Service® (MLS®) System, compared with 1,102 in July 2022, an increase of 15%. July’s sales included 979 in the freehold-property class, up 18% from a year ago, and 284 in the condominium-property category, a 6% increase from July 2022. The five-year average for total unit sales in July is 1,621.

“Both transactions and average prices are up from last July indicating consumers remain confident in the market notwithstanding the two recent quarter-percent interest rate hikes by the Bank of Canada. We’re only a month into the third quarter, but based on July’s positive indicators, we are likely to see solid year-over-year results in the second half,” says Ottawa Real Estate Board President Ken Dekker.

By the Numbers – Average Prices*:

  • The average sale price for a freehold-class property in July was $754,188, an increase of 5% from 2022, and a 1% increase over June 2023 prices.

  • The average sale price for a condominium-class property was $435,094 an increase of 2% from a year ago, although 3% lower than June 2023 prices.

  • With year-to-date average sale prices at $735,103 for freeholds and $433,447 for condos, these values represent a 9% decrease over 2022 for freehold-class properties and a 6% decrease for condominium-class properties.


“July’s average prices are showing positive gains over last year, and year-to-date numbers, as expected, are still closing the gap from the peak pandemic market activity of early 2022. Additionally, inventory continues to climb steadily as new listings are added to the housing stock, creating more options for homebuyers. August may be a slower month in Ottawa, but I wouldn’t take a vacation from shopping for your home.”

By the Numbers – Inventory & New Listings:

  • July’s new listings (2,234) were 6% lower than July 2022 (2,364) and down 19% from June 2023 (2,755). The 5-year average for new listings in July is 2,336.

  • Months of Inventory for the freehold-class properties has decreased to 2.7 months from 2.9 months in July 2022 but increased from 2.1 months in June 2023.

  • Months of Inventory for condominium-class properties has decreased to 2.3 months from 2.5 months in July 2022, but is up from 1.4 months in June 2023.

  • Days on market (DOM) for freeholds have increased to 26 days from 20 days in July 2022 and 23 days from June 2023.

  • Days on market (DOM) for condos have increased to 28 days from 20 days in July 2023 and 27 days in June 2023.


“Although we are in a sellers’ market again, the pandemic’s frenzy has calmed considerably. Sellers need to manage their expectations with true market activity — not every property will automatically see multiple offers or immediate sales. Ultimately, a property’s price is determined by how much a buyer is willing to pay. Using the marketing and negotiation skills of a professional licensed REALTOR® is instrumental for both buyers and sellers in this fluid market.”

REALTORS® also help with finding rentals and vetting potential tenants. Since the beginning of the year, OREB Members have assisted clients with renting 3,921 properties compared to 3,528 last year at this time, an increase of 11%.

(Source: OREB)

Read
This website may only be used by consumers that have a bona fide interest in the purchase, sale, or lease of real estate of the type being offered via the website. The data relating to real estate on this website comes in part from the MLS® Reciprocity program of the PropTx MLS®. The data is deemed reliable but is not guaranteed to be accurate.