RSS

OTTAWA REAL ESTATE-JUNE STATS (2026)

Ottawa Market Remains Balanced as Supply Shapes June Conditions

Ottawa’s housing market remained balanced in June, with activity easing in line with typical early-summer patterns, though trailing slightly behind 2025 activity levels. Supply remains elevated by recent years’ standards, continuing to give buyers more choice.

The impact of the elevated inventory is presenting differently by property type: single-family homes remained comparatively steady, townhomes showed more volatility, and apartment-style properties continue to be the softest segment.

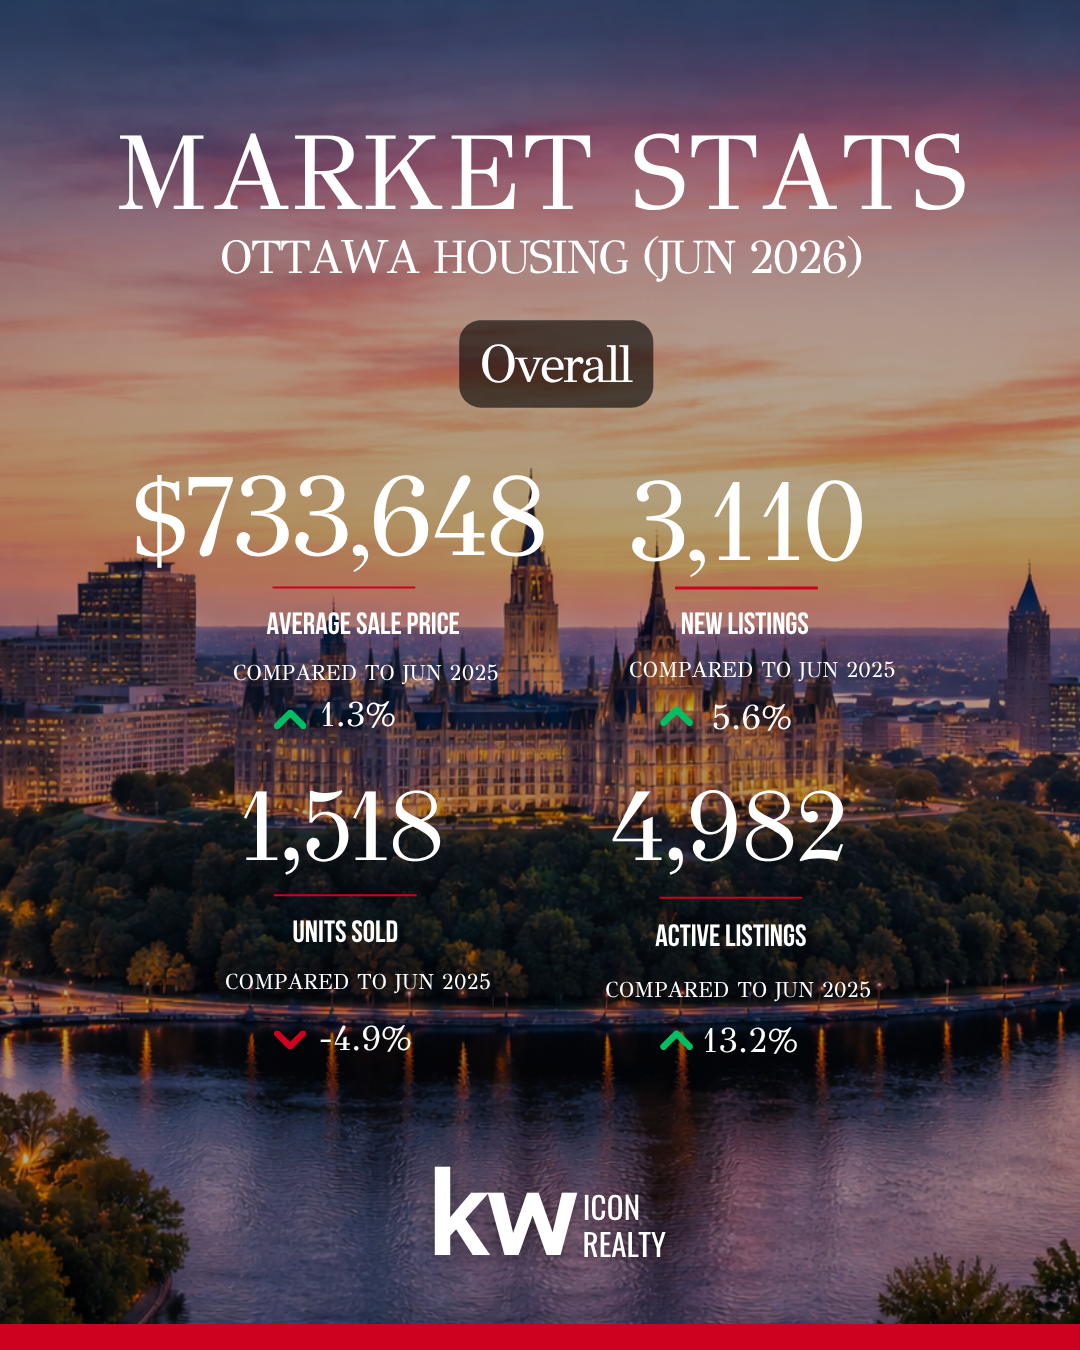
Pricing reflected that mixed picture. The average residential sale price was $733,648 in June, up 1.3% from a year earlier, while the median price was $655,000, down 1.3%.

The market continues to unfold against a cautious economic backdrop, though economic indicators are less gloomy than last month leading to some guarded optimism. The Bank of Canada held its policy rate in June, and Statistics Canada reported that real GDP grew in April after contracting in March. At the same time, uncertainty around North American trade policy continues to weigh on the broader economic outlook.

Overall, June showed a market that remains steady but is more divided beneath the surface. Supply is shaping conditions, but not overwhelming them, and the next phase of the market will depend on how well demand continues to absorb available listings across different property types.

“As we move through the summer market, the key story isn’t simply higher inventory, it’s how well demand continues to absorb that supply,” said OREB President Tami Eades. “Ottawa remains a fundamentally balanced market, but we’re seeing clear differences emerge between property types and neighbourhoods. That’s why buyers and sellers should focus less on citywide headlines and more on local market conditions. Working with a REALTOR® who understands those micro-market dynamics is more valuable than ever.”

Residential Market Activity

In June, 1,518 homes were sold through the MLS® System in Ottawa, a 4.9% decrease compared to June 2025. While sales were lower than May’s 1,616, that decline is consistent with the normal transition from the spring market into the early-summer period.

Sales activity varied by property type. Single-family homes continued to account for the largest share of activity, with 879 sales in June, down 1.8% from a year earlier. Townhouse sales totalled 429, down 7.3%, while apartment-style properties recorded 178 sales, down 14.0%.

This reinforces the property-type divide that has been building through the first half of the year: single-family demand has been steadier, while townhomes and especially apartments have carried more of the market softness.

Year to date, 6,969 homes have sold in Ottawa, down 6.1% from the same period in 2025. Total dollar volume was $4.9 billion, down 6.2% year over year. The year-to-date figures point to a market that remains active, but still below last year’s sales pace as the first half of 2026 comes to a close.

Prices and Market Balance

June’s price story was about how supply is being absorbed across different parts of the market. The average price was higher than a year ago, while the median price and benchmark measures were softer, suggesting that property mix continued to influence the headline numbers.

New listings were up year over year, active listings continued to rise, and the sales-to-new-listings ratio settled at 48.8%. Months of inventory reached 3.3, up from 2.8 last June. These figures remain consistent with balanced-market conditions.

Importantly, the additional supply has not translated into a broad weakening in transaction conditions. The sale-to-list price ratio remained at 98.5%, unchanged from June 2025, while the median days on market rose only modestly from 19 to 22 days. That suggests Ottawa is seeing more pricing discipline, not a complete shift in market conditions.

The property-type split is the clearest market-balance signal. Single-family homes remained the most stable segment, with 2.8 months of inventory and the strongest sale-to-list ratio among the major property types.

Townhomes continued to adjust as listings accumulated, with active inventory up 27.6% from last June and months of inventory rising to 3.2.

Apartment-style properties (condos) remained the softest segment, with 5.3 months of inventory and weaker benchmark pricing than the broader market.

The MLS® Home Price Index, which helps adjust for changes in the mix of homes sold, reinforced this divide. The composite benchmark price was down 1.3% year over year, with single-family down 0.7%, townhomes down 3.9%, and apartments down 6.0%.

Overall, June does not point to a market-wide price correction. It points to a balanced market where elevated supply is creating more pricing pressure, and where the clearest signs of high-supply effects remain concentrated in townhomes and apartment-style properties rather than across Ottawa as a whole.

Regional Market Comparison

Ottawa’s regional data reinforced the broader theme of a balanced but uneven market. The three suburban submarkets continued to account for most of the city’s sales activity, led by Ottawa Suburb South with 382 sales, Ottawa Suburb West with 373, and Ottawa Suburb East with 328. Together, those three areas represented more than 70% of Ottawa’s June sales.

The suburban picture was not uniform. Ottawa Suburb South recorded the highest sales total, but Ottawa Suburb West showed the firmest absorption, with the highest sales-to-new-listings ratio among the seven submarkets and the lowest months of inventory.

Ottawa Suburb East remained active, though sales were lower than last year and new listings were up, pointing to more choice for buyers.

Central and rural markets were more uneven. Ottawa Centre recorded 143 sales and had higher months of inventory than the citywide level, while Ottawa Rural East was the only submarket to post year-over-year sales growth. Rural West and Rural South had smaller transaction totals, which makes monthly movements more variable, but both continued to show more supply-sensitive conditions.

Overall, the regional data points to a market shaped by local differences rather than one broad trend. Suburban areas continue to drive most activity, but absorption, supply, and pricing conditions vary meaningfully by area.

Looking Ahead

As Ottawa moves through the summer market, the most useful signals will come less from any single month of sales and more from whether demand continues to absorb elevated supply at a steady pace. REALTORS® should be watching the sales-to-new-listings ratio, months of inventory by property type, median days on market, and whether price trends continue to diverge between single-family, townhouse, and apartment-style properties.

CMHC’s latest data adds important context to the supply story. Ottawa had 17,212 housing units under construction in May,with nearly 14,000 of those apartment units. Combined with national demographic data pointing to slower population growth and fewer non-permanent residents, there remains the possibility of an influx of apartment-style units into the market in a way that could significantly impact market conditions.

While this does not point to an immediate oversupply issue as completed and unabsorbed apartment inventory remains low with 37 apartment units reported in May; it does suggest future pressure will depend less on construction activity itself and more on whether demand continues to keep pace as projects are completed.

The rental side should also be monitored carefully. CMHC reported a 3.0% primary rental vacancy rate in Ottawa in 2025, while the condominium rental vacancy rate was much tighter at 0.6%. That means the apartment outlook is not simply a story of excess supply. It is a question of how resale demand, rental demand, investor activity, and new apartment completions interact over time.

REALTORS® in Ottawa, as always, would do well to thoroughly understand the micro-market they are operating in for their clients.

(SOURCE: OREB)

Read

OTTAWA REAL ESTATE-MAY STATS (2026)

Seasonal Activity Improves, but Ottawa’s May Market Remains Cautious

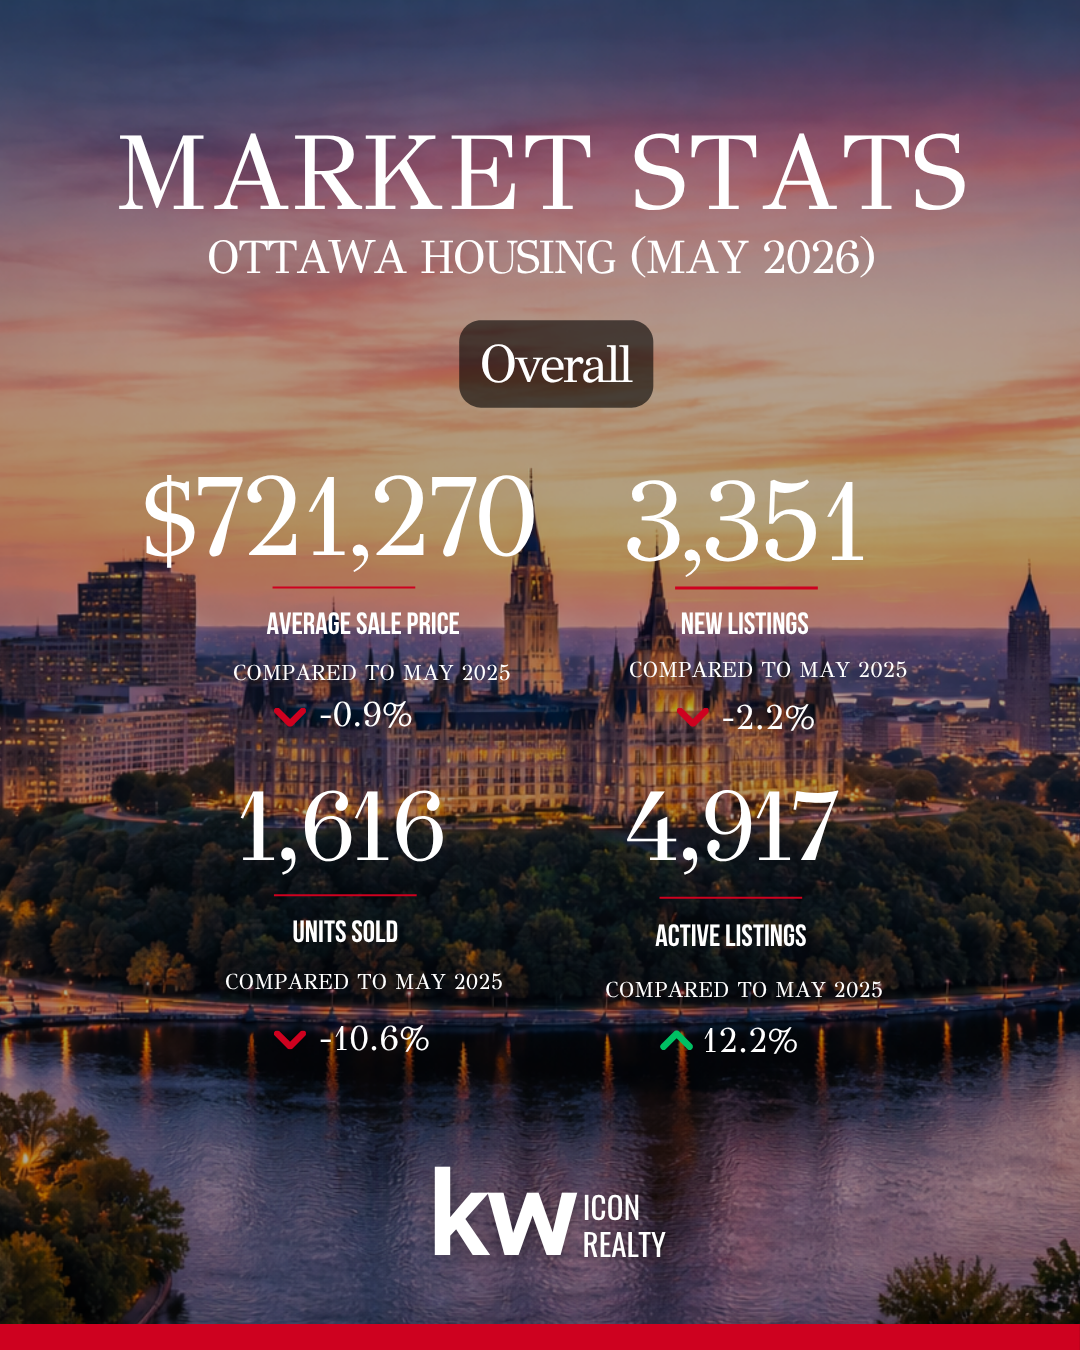
Ottawa’s housing market remained balanced in May, with activity improving from April but continuing to trail last year’s spring pace. A total of 1,616 homes sold in May, up from 1,336 in April, reflecting the typical lift as the spring market progressed. However, sales were down 10.6% compared to May 2025. These slower sales are becoming a theme thus far in 2026, even as the market remains active.

The sales-to-new-listings ratio rose to 48.2%, while months of inventory eased to 3.0, indicating demand kept better pace with new supply than it did in April. Active listings remained elevated at 4,917, keeping pressure on sellers to price strategically.

Average prices across market segments were mixed, though overall pricing remained relatively stable. Single-family home pricing was flat year over year, while average prices for townhomes and apartments saw modest declines. Overall pricing was less than one percentage point below last year’s level, indicating continued market stability. The average residential sale price was $721,270 in May, up from $712,184 in April, and relatively flat at 0.9% below May 2025. The median sale price followed a similar pattern, rising to $660,000 from $650,000 in April while remaining 1.6% lower than last May.

Performance varied by property type. Single-family homes remained resilient, with average prices essentially unchanged year over year and the median price up 1.3%. Townhomes and apartment-style properties continued to face softer conditions, with both average and median prices below last year’s levels.

The MLS® Home Price Index (HPI) composite benchmark price increased 0.9% from April but remained 0.6% below May 2025, reflecting continued variation across market segments.

Economic uncertainty continues to influence market activity. Recent GDP data has fueled discussion about Canada’s economic momentum, while the Bank of Canada has continued to take a cautious approach to interest rates. CMHC data reported lower employment levels in the first quarter compared to a year earlier, while CREA’s labour-market charts point to stronger full-time job growth and an unemployment rate that has eased from its early-2026 peak.

Ottawa’s market remains balanced, but the data also points to clear challenges. Sales continue to lag last year’s pace, inventory is elevated, and softer segments are weighing on the broader price picture. The strength of the summer market will depend on whether demand continues to absorb supply at a steady pace.

“The Ottawa market is not moving in one direction across all property types,” says OREB President Tami Eades. “May brought the seasonal increase in activity we typically expect to see in Ottawa’s housing market, but sales continue to trail last year’s pace. While economic uncertainty continues to influence consumer confidence, the key question moving into the summer market will be whether demand continues to keep pace with supply. The market remains active, but inventory levels, employment trends, and buyer confidence will all play an important role in shaping the months ahead.”

Residential Market Activity

In May, 1,616 homes were sold through the MLS® System in Ottawa, a 10.6% decrease compared to May 2025, but a clear increase from 1,336 sales in April. The month-over-month gain reflects the typical spring lift in activity, even as demand continues to trail last year’s stronger spring pace.

Sales activity was down in May compared to 2025, though the extent of that decline varied by property type. Single-family homes recorded 904 sales in May, down 8.6% from a year earlier. Townhouse sales totalled 481, down 14.3%, while apartment-style properties recorded 203 sales, down 12.1%. The segment-level results point to a market where demand remains present, but activity is trailing 2025 across all segments.

Supply remained elevated. New listings totalled 3,351 in May, down 2.2% from May 2025, while active listings rose to 4,917 units, up 12.2% year over year and above April’s 4,535 listings. While new listings did not surge this month, the elevated level of active inventory shows that supply has continued to accumulate.

The sales-to-new-listings ratio improved to 48.2%, up from 41.0% in April and consistent with balanced market conditions.

Year to date, 5,453 homes have sold in Ottawa, down 6.3% from the same period in 2025. New listings total 12,284, up 5.4%, while average active listings are up 14.8%. The year-to-date sales-to-new-listings ratio of 44.4% and 3.5 months of inventory point to a market that remains balanced overall, but one where sellers face more competition than they did last spring.

Prices and Market Balance

Price trends remained stable in May, but they were not uniform across property types. The average residential sale price in May was $721,270, down 0.9% from May 2025 but up from $712,184 in April. The median price was $660,000, down 1.6% year over year and up from $650,000 in April. Year to date, the average price is $694,539, down 0.6%, while the median price is $639,000, down 1.7%.

Single-family homes remained the most resilient segment, with an HPI benchmark price of $723,800, up 0.9% from April and 0.3% year over year. The average single-family sale price was essentially unchanged from last May, while the median price rose 1.3% to $800,000.

The townhome segment softened in May data compared to recent months. Earlier in the year, townhome activity was holding up comparatively well, but May reversed that pattern. Townhouse sales fell 14.3% year over year, pulling year-to-date sales 2.8% below 2025. Pricing has not fallen sharply month over month, with the townhouse HPI benchmark at $557,500, down 0.4% from April and 3.2% from last May. The larger signal is softer absorption, as active listings remain elevated and months of inventory sit well above last year’s level.

Apartment-style properties continued to show the most pronounced pressure. The apartment benchmark price was $385,500, up 1.5% from April but down 6.7% from May 2025. Average and median apartment prices were also lower year over year. This weakness is not unique to Ottawa; Toronto’s condo sector has also been affected by weaker investor demand and higher carrying costs. Ottawa’s apartment segment, however, should still be understood within local conditions: the data points to a slower, more price-sensitive segment, not a broad market correction.

Months of Inventory:

  • Single-Family: 2.7

  • Townhome: 2.7

  • Apartment: 4.8

Ottawa is not experiencing broad-based price growth, but neither is the market showing a uniform decline in price. Single-family homes continue to provide support, townhomes are adjusting, and apartment-style properties remain the softest part of the market. For sellers, accurate pricing remains critical; for buyers, the data points to a market where patience and property-specific analysis matter more than broad assumptions about Ottawa as a whole.

Regional Market Comparison

Ottawa’s regional picture was uneven in May, reinforcing that the citywide market is not moving as one single market. The central market and Ottawa Rural West were the only subareas to record year-over-year sales gains, while the suburban areas continued to drive most of the overall activity.

Ottawa Centre had the clearest positive activity signal, with sales up 13.5% from May 2025 and prices also higher year over year. This suggests stronger engagement in the central market after a softer start to the year, though the area’s varied property mix means monthly price movements should be interpreted with some caution.

The suburban markets remained the core of Ottawa’s sales activity, but the story differed by area. Ottawa Suburb West recorded the highest sales total and the lowest months of inventory, pointing to relatively stronger absorption. However, prices were lower than last May, so its strength was more about activity than price growth. Ottawa Suburb South remained steady but softer than last year, while Ottawa Suburb East saw a sharper decline in sales even as prices moved higher.

Rural markets were more variable, which is typical given smaller transaction volumes. Ottawa Rural West was the relative bright spot, with sales slightly above last May, while Ottawa Rural East and Rural South both recorded weaker activity. Rural East also had the highest inventory level among the subareas, pointing to slower absorption.

Overall, the regional data points to a market shaped by local differences rather than one broad trend. Central Ottawa improved in May, the west remained active, and rural conditions were more uneven. For buyers and sellers, neighbourhood, property type, and local competition continue to matter more than the citywide averages alone. Detailed regional tables are available in the non-HPI report included in the monthly stats package.

Looking Ahead

As Ottawa moves into the summer market, the most useful signals will come less from broad forecasts and more from whether demand continues to absorb supply at a steady pace. REALTORS® should be watching the sales-to-new-listings ratio, months of inventory by property type, median days on market, sale-to-list ratios, and whether benchmark prices continue to diverge between single-family, townhouse, and apartment-style properties.

CMHC’s latest construction data adds important context. Housing starts were lower year over year across all dwelling types in April, but the pipeline is shifting in composition. Rental projects accounted for 61% of starts by market type, while apartments made up most new starts and the large majority of units currently under construction. That changing mix will matter most for apartment-style resale pricing, investor demand, and rental-market competition as projects move toward completion.

Completed and unabsorbed inventory should also be monitored closely. CMHC’s April data shows this inventory has risen, with the largest concentration in row and single-detached homes. For REALTORS®, absorption of newly completed units will be an important companion indicator to resale inventory, especially in segments where pricing has already become more sensitive.

Taken together, the indicators to watch are clear: resale inventory, new listings, absorption of completed new homes, the apartment-heavy construction pipeline, and local employment conditions. These will offer a better read on Ottawa’s next phase than any single month of sales or pricing data alone.

(SOURCE: OREB)

Read

OTTAWA REAL ESTATE - APRIL STATS (2025)

Momentum Builds in Ottawa’s Housing Market Amid Greater Certainty

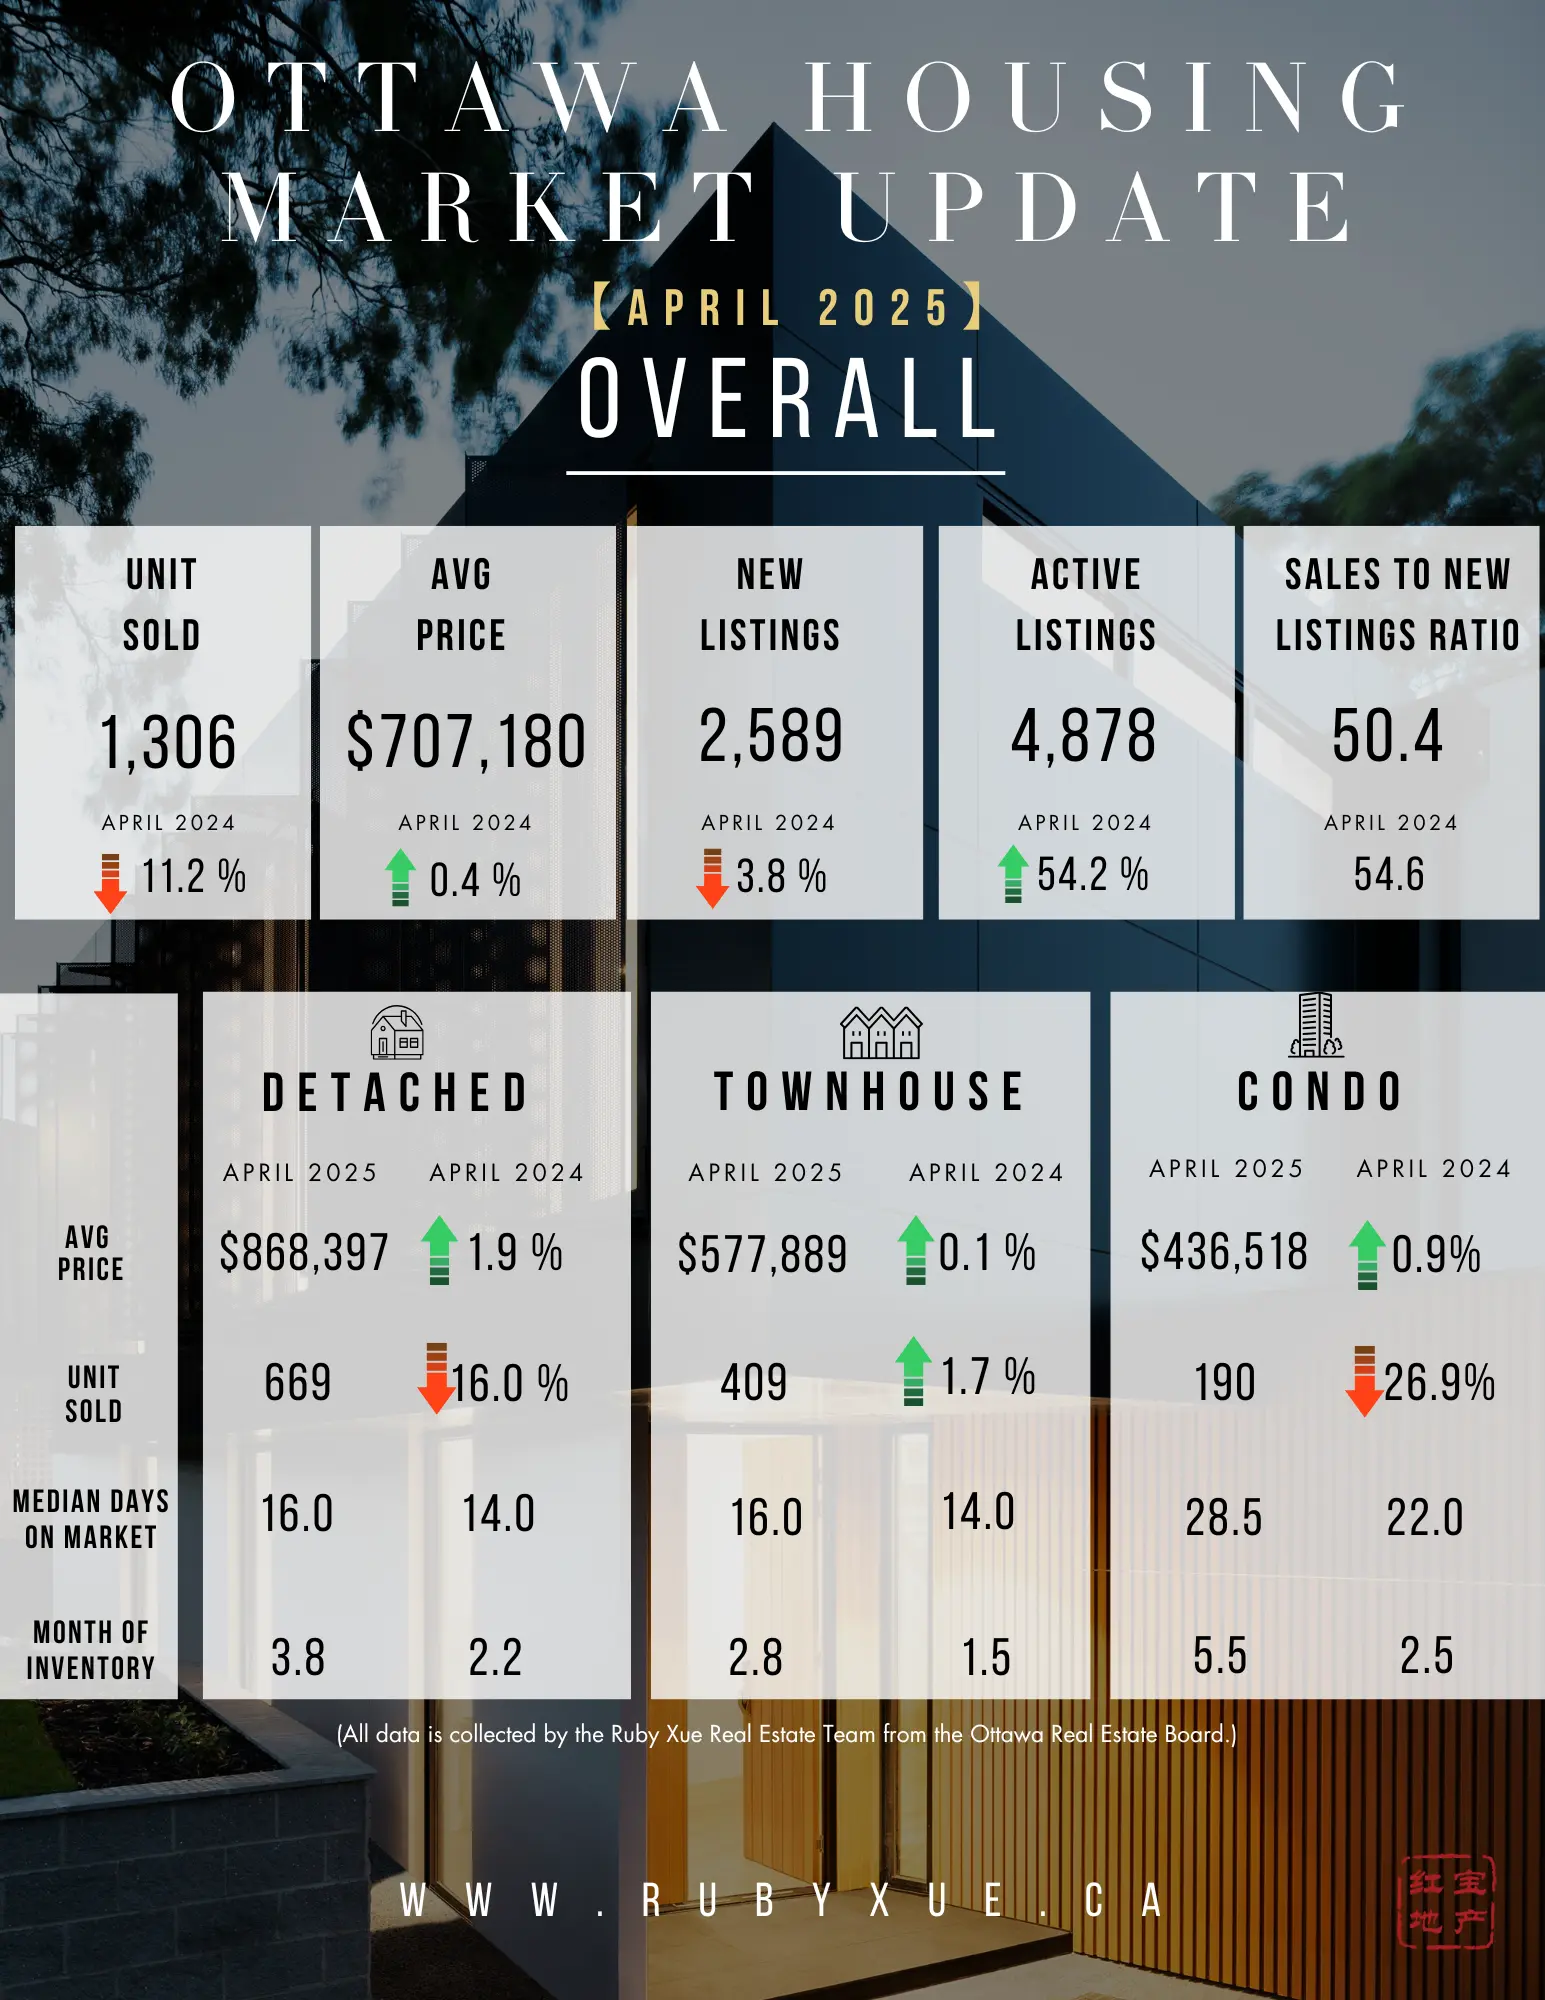
The number of homes sold through the MLS® System of the Ottawa Real Estate Board (OREB) totaled 1,306 units in April 2025. This represented an 18.4% increase from March 2025, but an 11.2% decline from April 2024.

Home sales were 17.6% below the five-year average and 16.2% below the 10-year average for the month of April.

“While April sales were down year-over-year, we saw a healthy month-over-month increase—an encouraging sign of growing momentum as we move through the spring market,” says OREB President Paul Czan. “Inventory remains at higher levels compared to previous years, indicating a gradual move towards a balanced market.”

“With more certainty following the federal election, buyers are returning with greater confidence—but they’re proceeding cautiously, taking their time, including conditions in their offers, and being more selective,” adds Czan. “Sellers, meanwhile, are adjusting to longer days on market, which makes strategic pricing and thoughtful home preparation more important than ever. If the listing is priced well, shows well, it’s moving—possibly getting multiple offers. Looking ahead, we’ll be watching how the federal government’s recent housing commitments translate into action. Policies aimed at increasing supply, improving affordability, and supporting first-time buyers are welcome steps toward meaningful impact here in Ottawa.”

By the Numbers – Prices:

  • The overall MLS® HPI composite benchmark price was $631,200 in April 2025, a 1.1% rise compared to April 2024.

    • The benchmark price for single-family homes was $703,200, up 1.0% year-over-year in April.

    • By comparison, the benchmark price for a townhouse/row unit was $440,000, an increase of 4.4% from 2024.

    • The benchmark apartment price was $404,000, a 2.8% decline from the previous year.

  • The average price of homes sold in April 2025 was $707,180, a 0.4% increase from April 2024.

  • The total dollar volume of all home sales in April 2025 amounted to $923.5 million, a 10.8% drop compared to the same period last year.

OREB cautions that the average sale price can be useful in establishing trends over time but should not be used as an indicator that specific properties have increased or decreased in value. The calculation of the average sale price is based on the total dollar volume of all properties sold. Prices will vary from neighbourhood to neighbourhood.

By the Numbers – Inventory & New Listings:

  • The number of new listings declined by 3.8% compared to April 2024, with 2,589 new residential properties added to the market. New listings were 2.8% above the five-year average and 5.6% above the 10-year average for the month of April.

  • Active residential listings totaled 4,878 units at the end of April 2025, reflecting a 54.2% surge from April 2024. Active listings were 86.9% above the five-year average and 51.3% above the 10-year average for the month of April.

  • Months of inventory stood at 3.7 at the end of April 2025, compared to 2.2 in April 2024. The number of months of inventory is the number of months it would take to sell current inventories at the current rate of sales activity.

    (SOURCE: OREB)

Read

OTTAWA REAL ESTATE - MARCH STATS (2025)

Ottawa Housing Market Shows Stability as Spring Momentum Builds

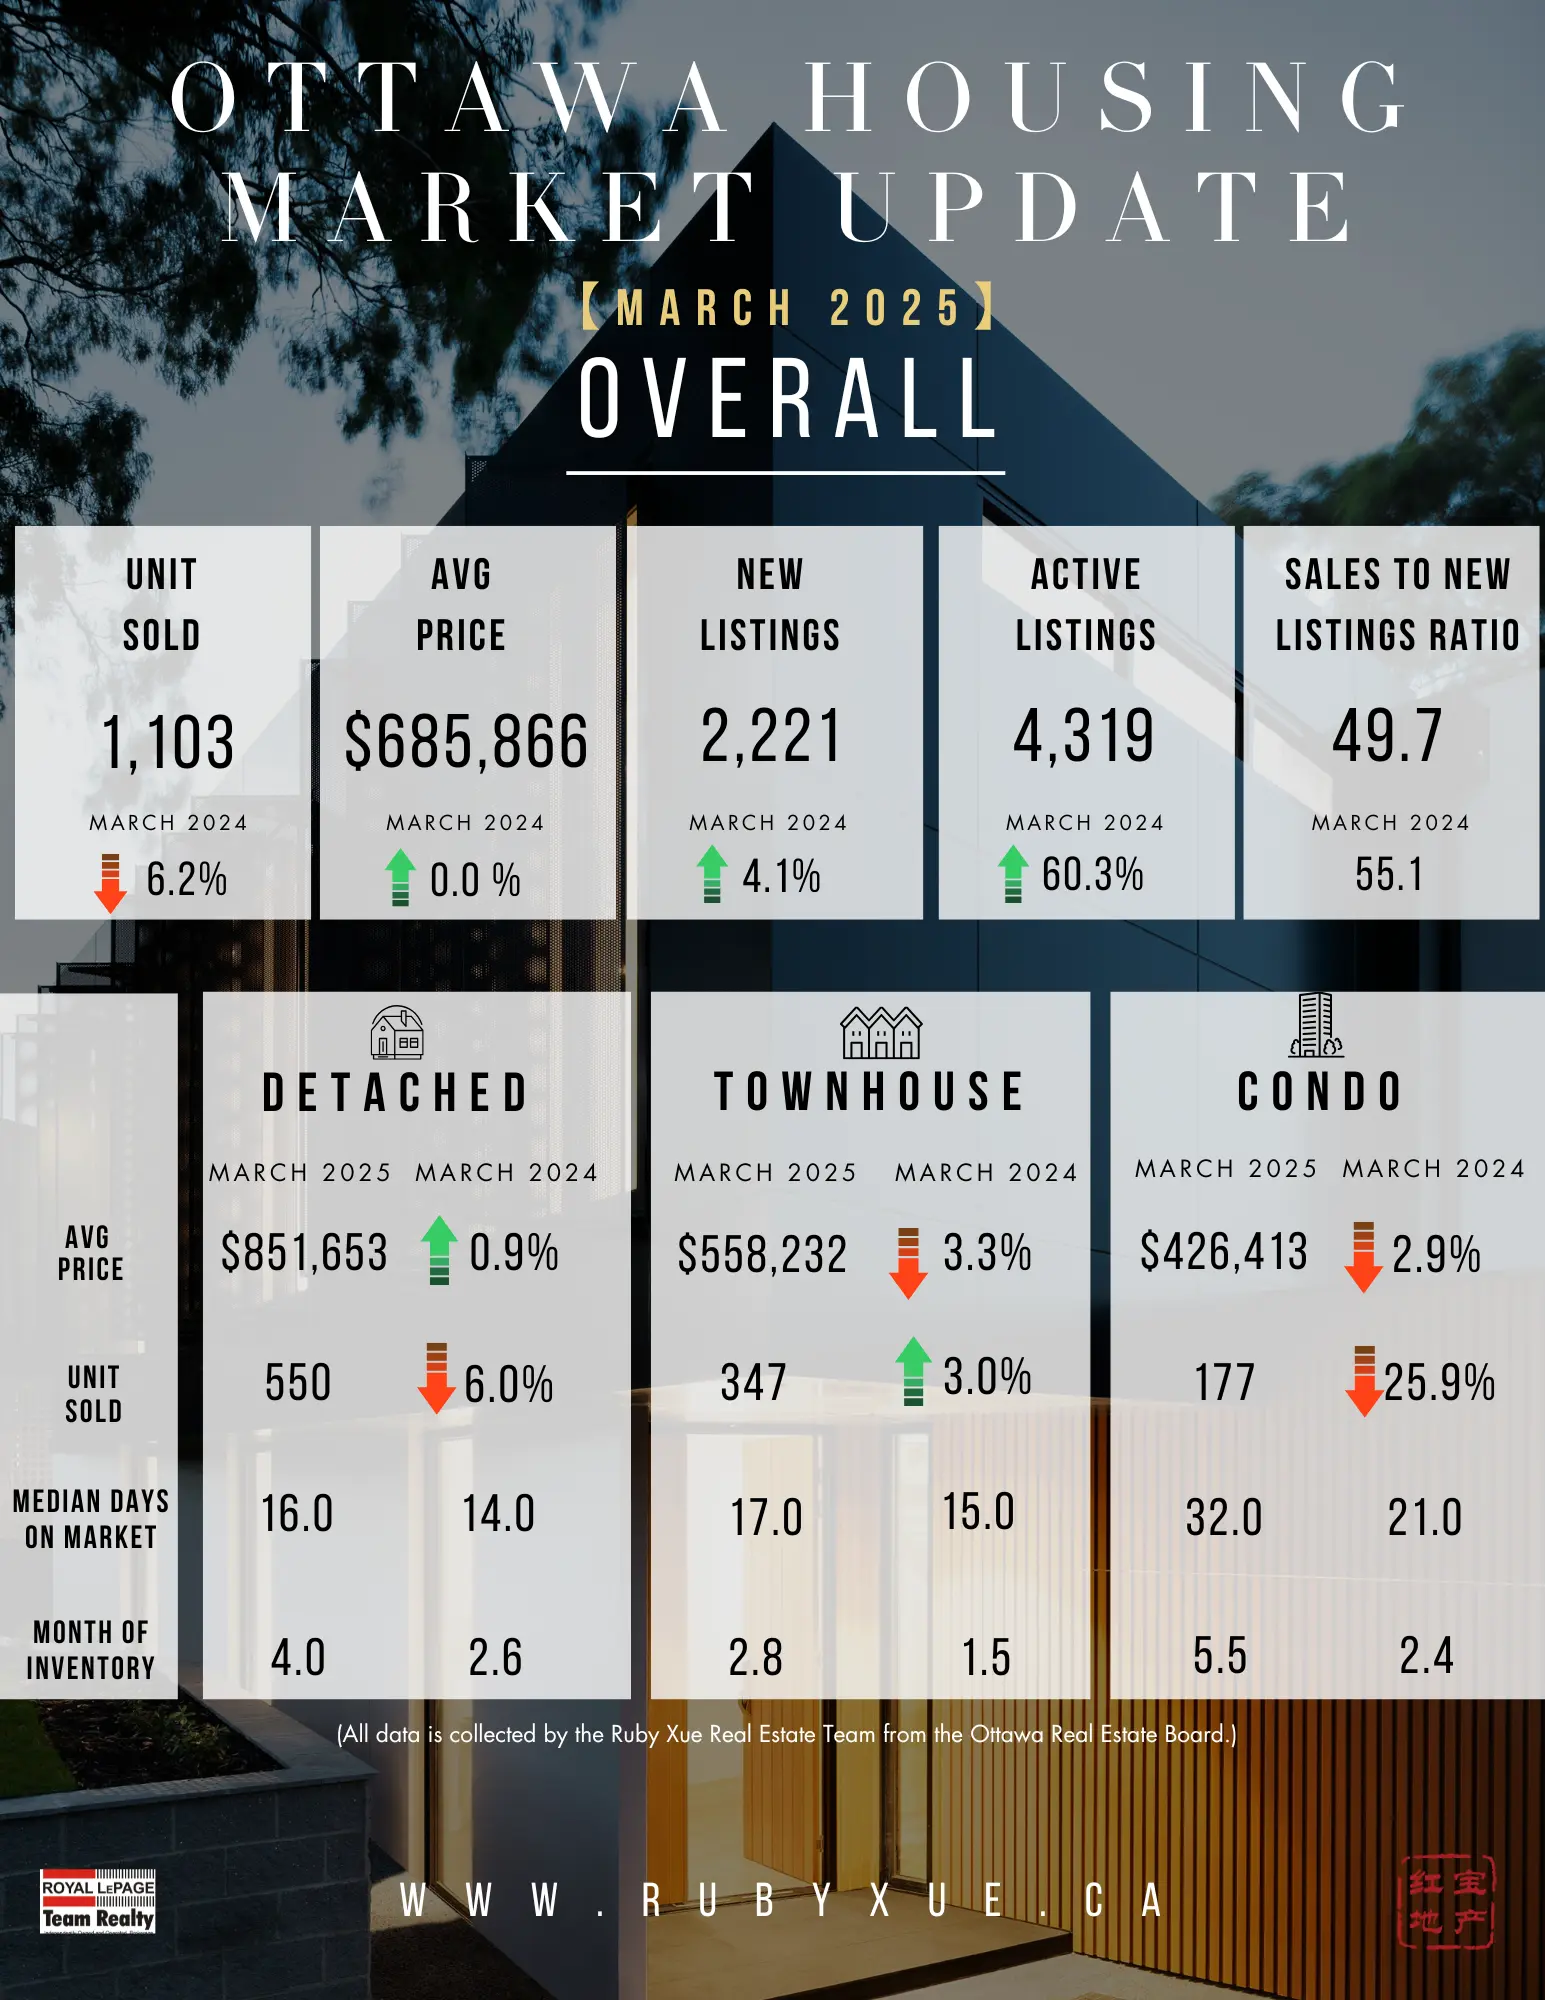
The number of homes sold through the MLS® System of the Ottawa Real Estate Board (OREB) totaled 1,103 units in March 2025. This represented a 6.2% decline from March 2024. 

Home sales were 24% below the five-year average and 19.3% below the 10-year average for the month of March.

“The Ottawa housing market in March 2025 remained relatively stable, with sales activity slightly lower than the same period last year,” said OREB President Paul Czan. “However, we’re seeing continued momentum month-over-month as the spring market gains traction. Both buyers and sellers are exercising some caution—likely due to economic uncertainty and the upcoming election—but the current lower interest rates are encouraging more activity as they step off the sidelines.”

“Looking ahead, the ongoing trade and tariff concerns could affect new construction and further exacerbate supply challenges,” Czan adds. “So, it’s critical that the City of Ottawa continues collaborating with key stakeholders. We were pleased to take part in discussions around the proposed New Zoning By-Law, which prioritizes housing options and opportunities to maximize options for Ottawa’s residents.”

By the Numbers – Prices:

  • The overall MLS® HPI composite benchmark price was $626,200 in March 2025, a 2.2% rise compared to March 2024.

    • The benchmark price for single-family homes was $698,700, up 2.7% year-over-year in March.

    • By comparison, the benchmark price for a townhouse/row unit was $431,200, a decline of 8.0% from 2024.

    • The benchmark apartment price was $400,900, a 4.3% decline from the previous year.

  • The average price of homes sold in March 2025 was $685,866, unchanged from March 2024.

  • The total dollar volume of all home sales in March 2025 amounted to $756.5 million, a 6.2% drop compared to the same period last year.

By the Numbers – Inventory & New Listings:

  • The number of new listings rose by 4.1% compared to March 2024, with 2,221 new residential properties added to the market. New listings were 0.7% below the five-year average and 2.2% below the 10-year average for the month of March.

  • Active residential listings totaled 4,319 units at the end of March 2025, reflecting a substantial 60.3% surge from March 2024. Active listings were 92.7% above the five-year average and 49.5% above the 10-year average for the month of March.

  • Months of inventory stood at 3.9 at the end of March 2025, compared to 2.3 in March 2024. The number of months of inventory is the number of months it would take to sell current inventories at the current rate of sales activity.

(SOURCE: OREB)

Read

OTTAWA REAL ESTATE - FEBRUARY STATS (2025)

Ottawa Real Estate Market Holds Steady Amid Changing Conditions

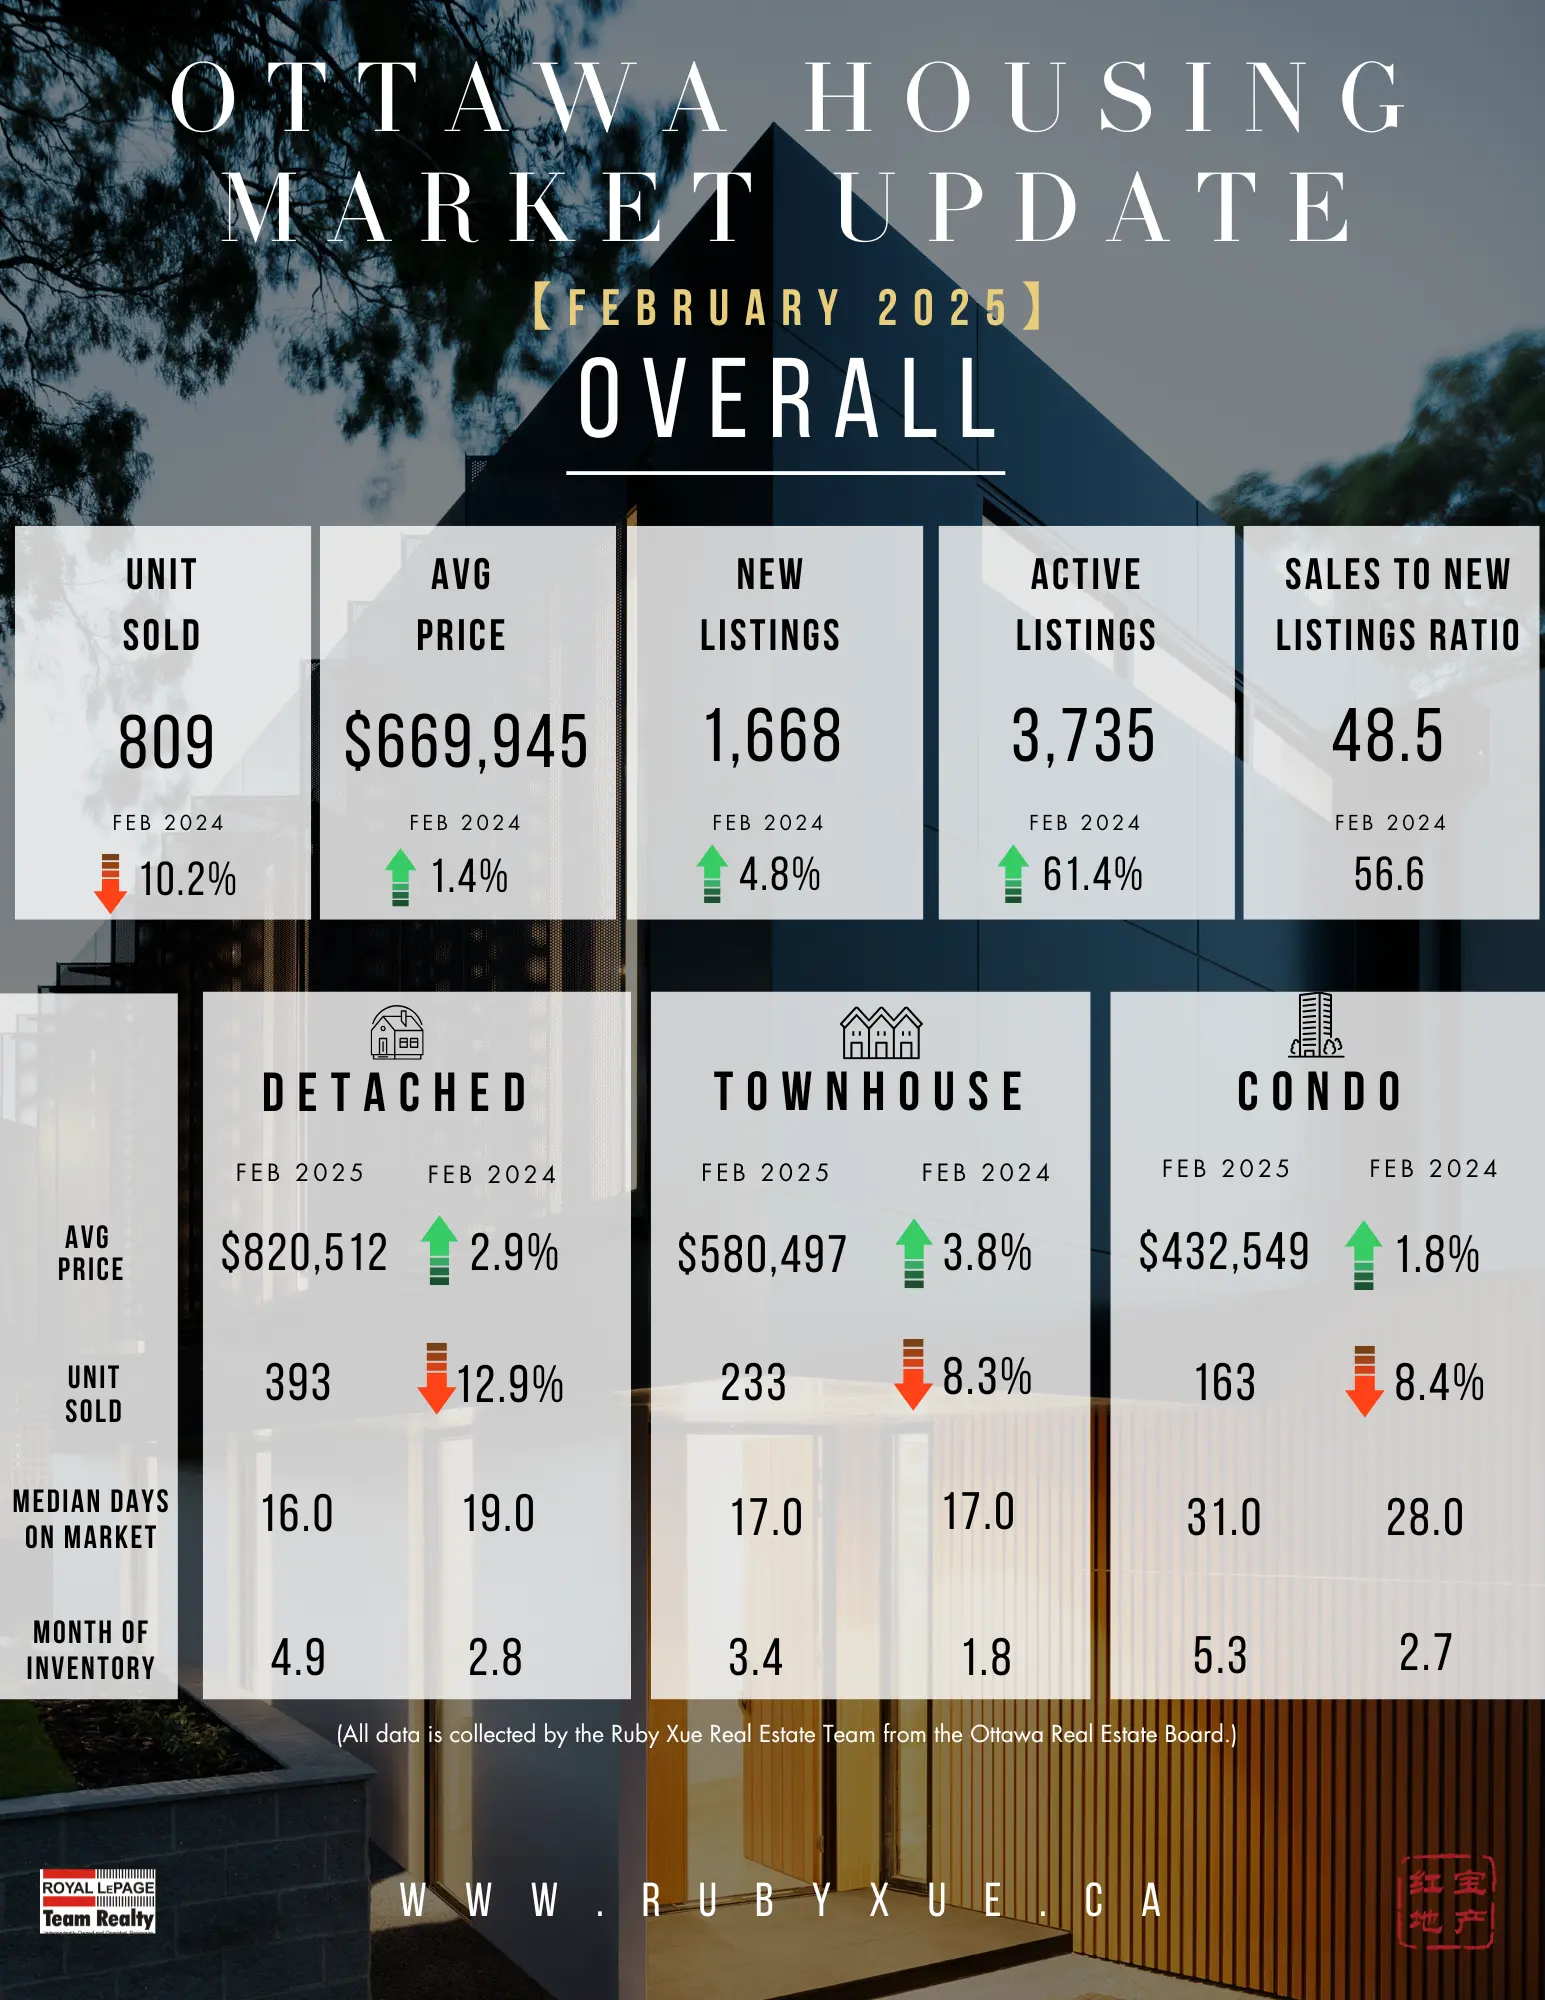
The number of homes sold through the MLS® System of the Ottawa Real Estate Board (OREB) totaled 809 units in February 2025. This represented a 10.2% decline from February 2024.

Home sales were 19.1% below the five-year average and 15.4% below the 10-year average for the month of February.

“Ottawa’s sales activity moderated while prices held steady,” says OREB President Paul Czan. “Despite increased inventory, market uncertainty continues to influence buyer and seller decisions. Some sellers who had previously delayed listing are now entering the market, contributing to more options for buyers. While demand remains strong in certain price segments, the pace of sales varies, making strategic pricing and preparation key for sellers.”

“The Bank of Canada’s influence on borrowing power, ongoing economic factors like tariffs, and the potential impact of upcoming elections are also shaping buyer and seller sentiment,” adds Czan. “As we approach the spring market, we anticipate increased buyer activity, particularly if interest rates trend downward and confidence continues to build.”

By the Numbers – Prices:

The MLS® Home Price Index (HPI) tracks price trends far more accurately than is possible using average or median price measures.

  • The overall MLS® HPI composite benchmark price was $658,300 in February 2025, a 4.4% rise compared to February 2024.

    • The benchmark price for single-family homes was $719,800, up 1.3% year-over-year uptick in February.

    • By comparison, the benchmark price for a townhouse/row unit was $438,000, a decline of 11.6% from 2024.  

    • The benchmark apartment price was $459,300, a 4.5% gain from the previous year. 

  • The average price of homes sold in February 2025 was $669,945, a 1.4% improvement from February 2024. 

  • The total dollar volume of all home sales in February 2025 amounted to $541.9 million, an 8.9% drop compared to the same period last year.

OREB cautions that the average sale price can be useful in establishing trends over time but should not be used as an indicator that specific properties have increased or decreased in value. The calculation of the average sale price is based on the total dollar volume of all properties sold. Prices will vary from neighbourhood to neighbourhood.

By the Numbers – Inventory & New Listings:

  • The number of new listings rose by 4.8% compared to February 2024, with 1,668 new residential properties added to the market. New listings were 10.8% above the five-year average and 6.7% above the 10-year average for the month of February.

  • Active residential listings totaled 3,735 units at the end of February 2025, reflecting a substantial 61.4% surge from February 2024. Active listings were 95.7% above the five-year average and 51.4% above the 10-year average for the month of February.

  • Months of inventory stood at 4.6 at the end of February 2025, compared to 2.6 in February 2024. The number of months of inventory is the number of months it would take to sell current inventories at the current rate of sales activity.

(SOURCE: OREB)

Read

OTTAWA REAL ESTATE - JANUARY STATS (2025)

Ottawa’s Market Warms Up with More Listings and Cautious Buyers

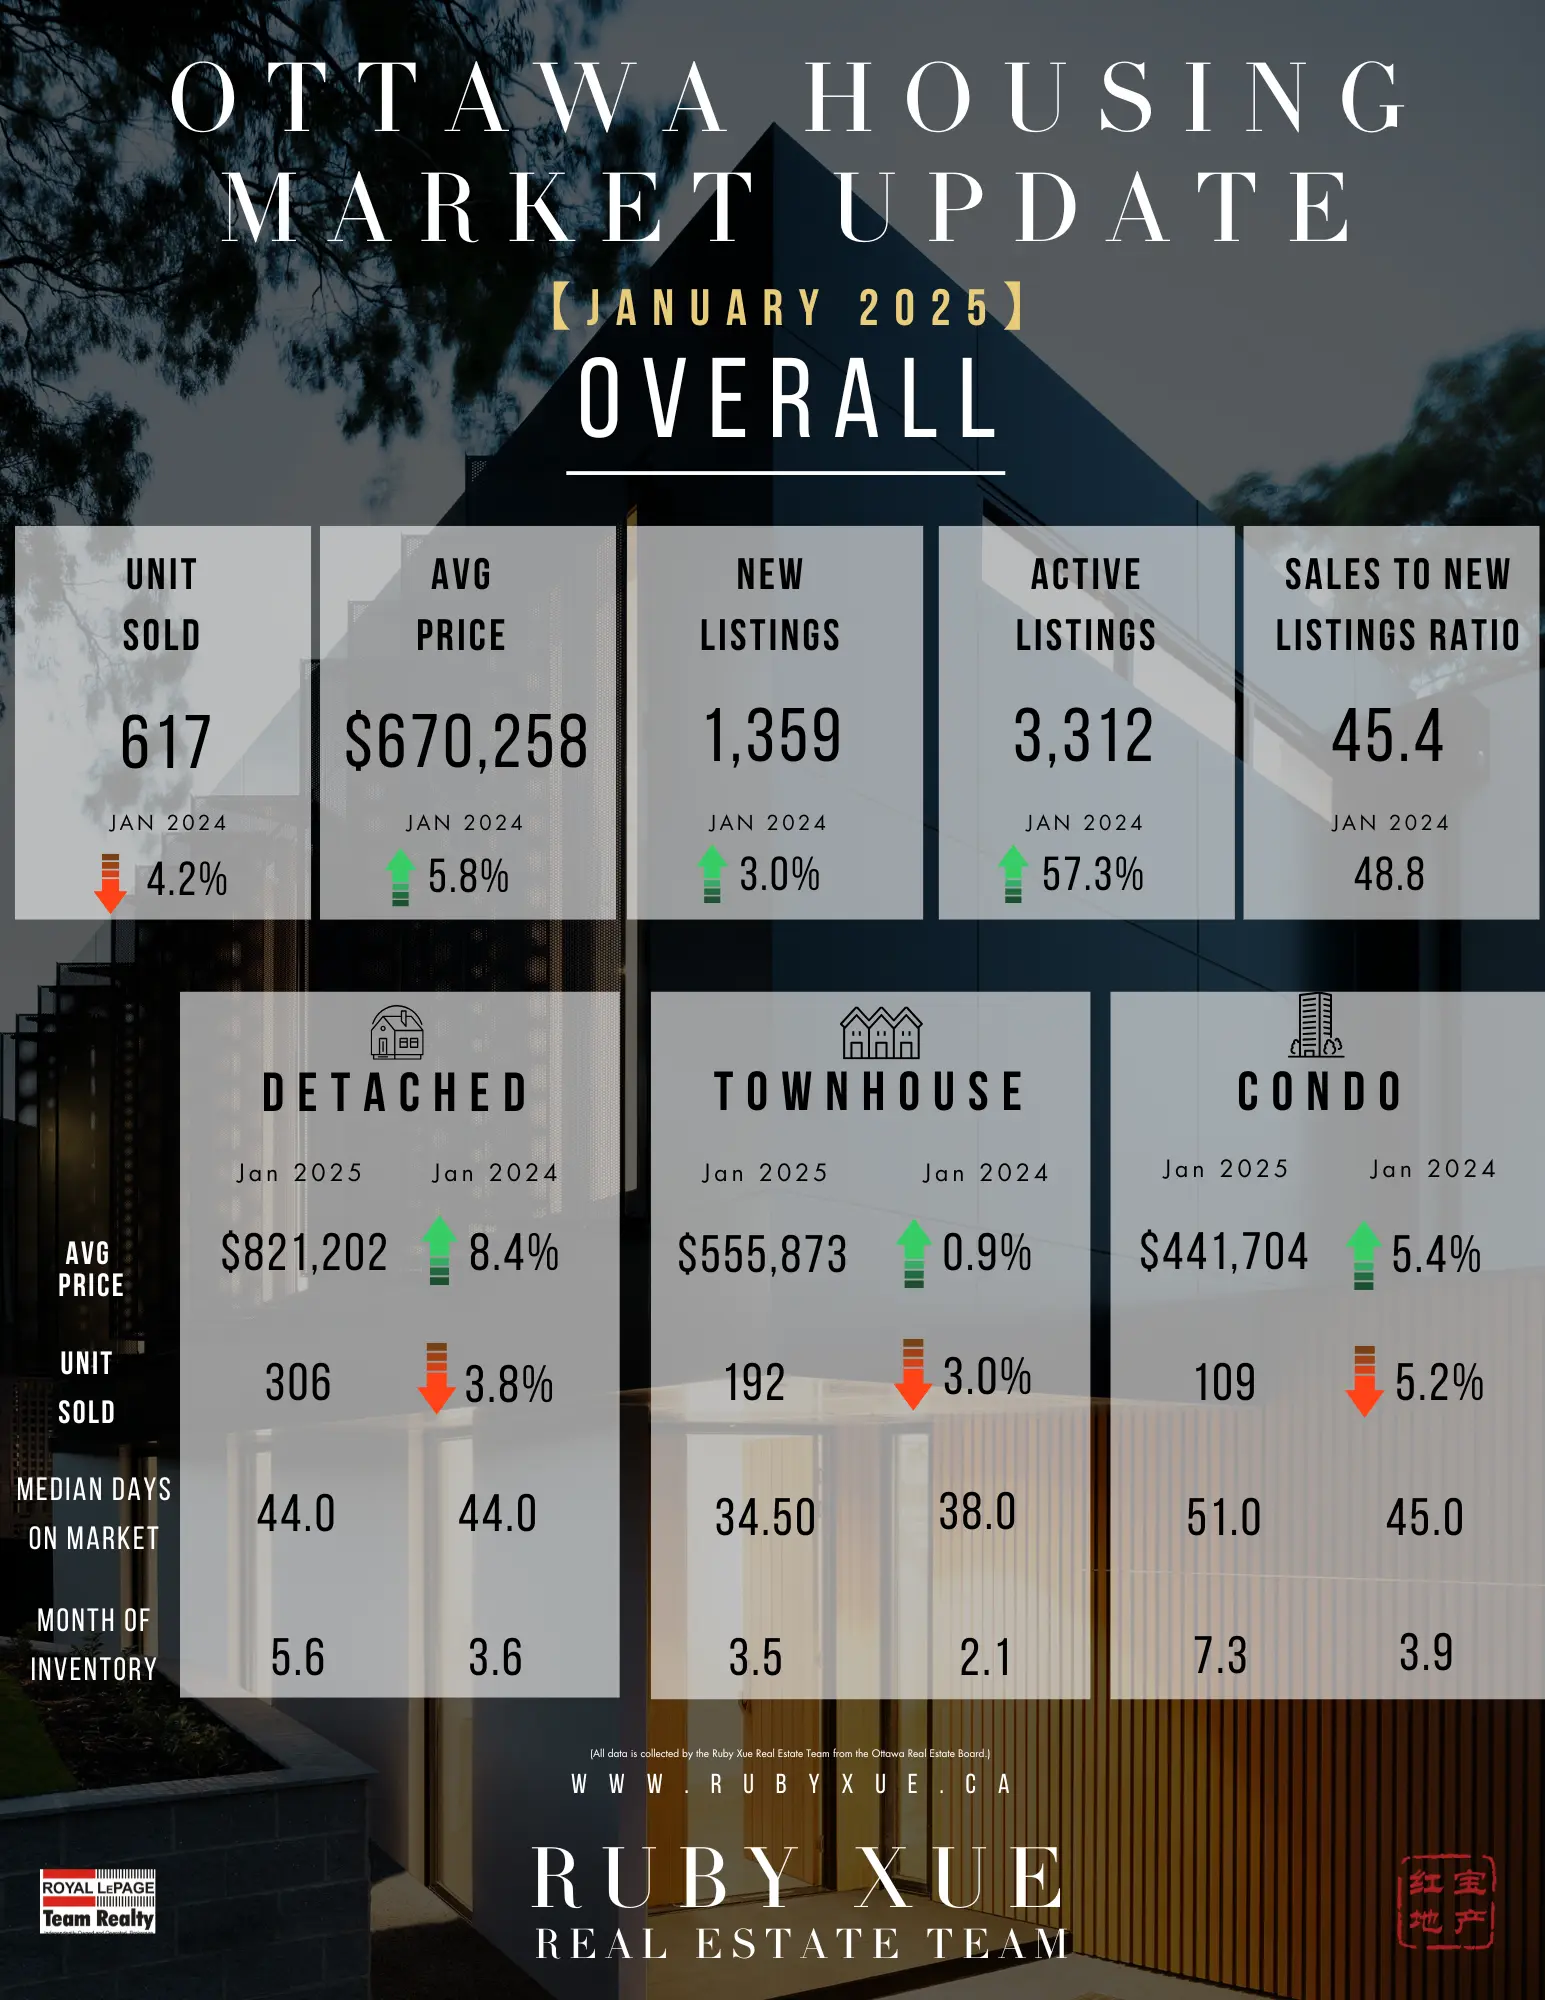
The number of homes sold through the MLS® System of the Ottawa Real Estate Board (OREB) totaled 617 units in January 2025. This was a 4.2% decrease from January 2024.    

Home sales were 13% below the five-year average and 9.6% below the 10-year average for the month of January. 

“Ottawa’s market is seeing increased activity as more listings hit the market and buyers start to re-engage,” says OREB President Paul Czan. “Many buyers and sellers had been waiting for more conducive market conditions, but with the recent rate cut and potentially lower interest rates on the horizon, optimism is growing. While there’s more supply, the availability of suitable properties in various market segments remains tight. This is reflected in some homes selling quickly while others linger on the market. Sellers should be prepared to price competitively and present their homes in the best light to capture buyer interest in this evolving market.”

“The recent Bank of Canada rate cut, introduction of U.S. tariffs, along with upcoming provincial and federal elections, introduce factors of variability,” adds Czan. “That said, confidence is growing, and more buyers are expected to return to the market in the coming months, leading to an increase in transactions.”

By the Numbers – Prices: 

The MLS® Home Price Index (HPI) tracks price trends far more accurately than is possible using average or median price measures. 

  • The overall MLS® HPI composite benchmark price was $649,900 in January 2025, an increase of 5.2% from January 2024.  

    • The benchmark price for single-family homes was $713,000 up 2.3% on a year-over-year basis in January.  

    • By comparison, the benchmark price for a townhouse/row unit was $448,000, down 3.9% compared to a year earlier.  

    • The benchmark apartment price was $436,900, up 4.5% from last year. 

  • The average price of homes sold in January 2025 was $670,258, increasing 5.8% from January 2024.  

  • The dollar volume of all home sales in January 2025 was $413.5 million, up 1.3% from January 2024.  

OREB cautions that the average sale price can be useful in establishing trends over time but should not be used as an indicator that specific properties have increased or decreased in value. The calculation of the average sale price is based on the total dollar volume of all properties sold. Prices will vary from neighbourhood to neighbourhood.  

By the Numbers – Inventory & New Listings 

  • The number of new listings saw an increase of 3.0% from January 2024. There were 1,359 new residential listings in January 2025. New listings were 14.1% above the five-year average and 9.3% above the 10-year average for the month of January. 

  • Active residential listings numbered 3,312 units on the market at the end of January 2025, a gain of 57.3% from January 2024. Active listings were 90.6% above the five-year average and 48.9% above the 10-year average for the month of January. 

  • Months of inventory numbered 5.4 at the end of January 2025, compared to 3.3 in January 2024. The number of months of inventory is the number of months it would take to sell current inventories at the current rate of sales activity. 

(SOURCE: OREB)

Read

OTTAWA REAL ESTATE - DECEMBER STATS (2024)

Ottawa’s MLS® December Market Closes Year with Optimism

The number of homes sold through the MLS® System of the Ottawa Real Estate Board (OREB) totaled 613 units in December 2024. This was a 7.9% increase from December 2023.  

Home sales were 6.8% below the five-year average and 2.7% below the 10-year average for the month of December.

On a year-to-date basis, home sales totaled 13,526 units in December 2024 — an increase of 11.8% from the same period in 2023.

“A year of wait-and-see came to a close with the expected slowdown over the holiday season,” says OREB President Paul Czan. “The latter half of the year brought signs of more favourable market conditions with consecutive interest rate drops, higher insured mortgage limits and extended amortizations. It’s early to assess the impact of these measures. And it’s an uphill battle against affordability and supply issues that persist.”

“Listing activity indicates that sellers anticipate improved conditions could spur more activity from buyers who have been keeping a close eye on the market but hesitant to make moves. Buyers are still limited in their selection of affordable inventory that can meet current demands, which stalls movement. While the improving market conditions are encouraging, the supply needs to be there. Coming political shifts are adding a layer of uncertainty but there is a trending optimism for more increased market activity in the months ahead.”

By the Numbers – Prices: 

The MLS® Home Price Index (HPI) tracks price trends far more accurately than is possible using average or median price measures. 

  • The overall MLS® HPI composite benchmark price was $645,800 in December 2024, an increase of 3.8% from December 2023.

    • The benchmark price for single-family homes was $729,300, up 3.7% on a year-over-year basis in December.

    • By comparison, the benchmark price for a townhouse/row unit was $533,200, up 11.3% compared to a year earlier.

    • The benchmark apartment price was $404,400, down 2.5% from last year.

  • The average price of homes sold in December 2024 was $663,781, increasing 4.4% from December 2023. The more comprehensive year-to-date average price was $679,067, increasing by 1.3% from last year.

  • The dollar volume of all home sales in December 2024 was $406.9 million, up 12.7% from December 2023. The total dollar volume of all home sales in 2024 was $9.2 billion, up 13.3% from all of 2023.

OREB cautions that the average sale price can be useful in establishing trends over time but should not be used as an indicator that specific properties have increased or decreased in value. The calculation of the average sale price is based on the total dollar volume of all properties sold. Prices will vary from neighbourhood to neighbourhood.  

By the Numbers – Inventory & New Listings 

  • The number of new listings saw an increase of 13.6% from December 2023. There were 603 new residential listings in December 2024. New listings were 3.5% above the five-year average and 2.7% below the 10-year average for the month of December.

  • Active residential listings numbered 3,216 units on the market at the end of December 2024, a gain of 58.7% from December 2023. Active listings were 90% above the five-year average and 51.4% above the 10-year average for the month of December.

  • Months of inventory numbered 5.2 at the end of December 2024, compared to 3.6 in December 2023. The number of months of inventory is the number of months it would take to sell current inventories at the current rate of sales activity.

(SOURCE: OREB)

Read

OTTAWA REAL ESTATE - NOVEMBER STATS (2024)

Ottawa’s MLS® Market Making Headway

The number of homes sold through the MLS® System of the Ottawa Real Estate Board (OREB) totaled 1,059 units in November 2024 — a slight dip down from the 1,179 units sold the month previous. 

Home sales were 3.1% below the five-year average and 0.5% below the 10-year average for the month of November. 

On a year-to-date basis, home sales totaled 12,882 units in November 2024 — an increase of 11.8% from the same period in 2023.  

“Ottawa’s market is making headway on a long road back from the slowdown experienced in 2023,” says OREB Past-President Curtis Fillier. “Buyers have been slow to come back to the market while watching the interest rates lower, and some are waiting to see how new mortgage rules — the extended amortization period and the increased default insurance cap — coming into effect in December may redefine their purchasing power. Sellers have noticed that caution and those who can are likely holding on for a more active spring.” 

“There will be the typical slowdown at this time of the year as people’s attentions turn to the holidays, and the snow starts to cover a property’s selling features,” says Fillier. “With prices holding steady and open houses getting traffic, though, people are keeping a close eye on opportunities.”  

By the Numbers – Prices: 

  • The MLS® Home Price Index (HPI) tracks price trends far more accurately than is possible using average or median price measures. 

    • The overall MLS® HPI composite benchmark price was $636,700 in November 2024, an increase of 1.5% from November 2023.

      • The benchmark price for single-family homes was $722,400, up 2.1% on a year-over-year basis in November.

      • By comparison, the benchmark price for a townhouse/row unit was $491,500, up 0.3% compared to a year earlier.

      • The benchmark apartment price was $406,200, down 3.7% from last year.

    • The average price of homes sold in November 2024 was $667,098 increasing 4.6% from November 2023.

    • The more comprehensive year-to-date average price was $679,797, increasing by 1.2% from November 2023.

    • The dollar volume of all home sales in November 2024 was $706.4 million, up 51.8% from November 2023.

    OREB cautions that the average sale price can be useful in establishing trends over time but should not be used as an indicator that specific properties have increased or decreased in value. The calculation of the average sale price is based on the total dollar volume of all properties sold. Prices will vary from neighbourhood to neighbourhood.  

    By the Numbers – Inventory & New Listings 

  • The number of new listings saw a decrease of 7.3% from November 2023. There were 1,352 new residential listings in November 2024. New listings were 6.3% below the five-year average and 0.3% above the 10-year average for the month of November.

  • Active residential listings numbered 4,036 units on the market at the end of November 2024, a gain of 38.2% from November 2023. Active listings were 72.8% above the five-year average and 44.3% above the 10-year average for the month of November.

  • Months of inventory numbered 3.8 at the end of November 2024, compared to 4.0 in November 2023. The number of months of inventory is the number of months it would take to sell current inventories at the current rate of sales activity.

    (SOURCE: OREB)

Read

OTTAWA REAL ESTATE - OCTOBER STATS (2024)

Consumer Confidence Cautiously on the Rise in Ottawa Resale Market

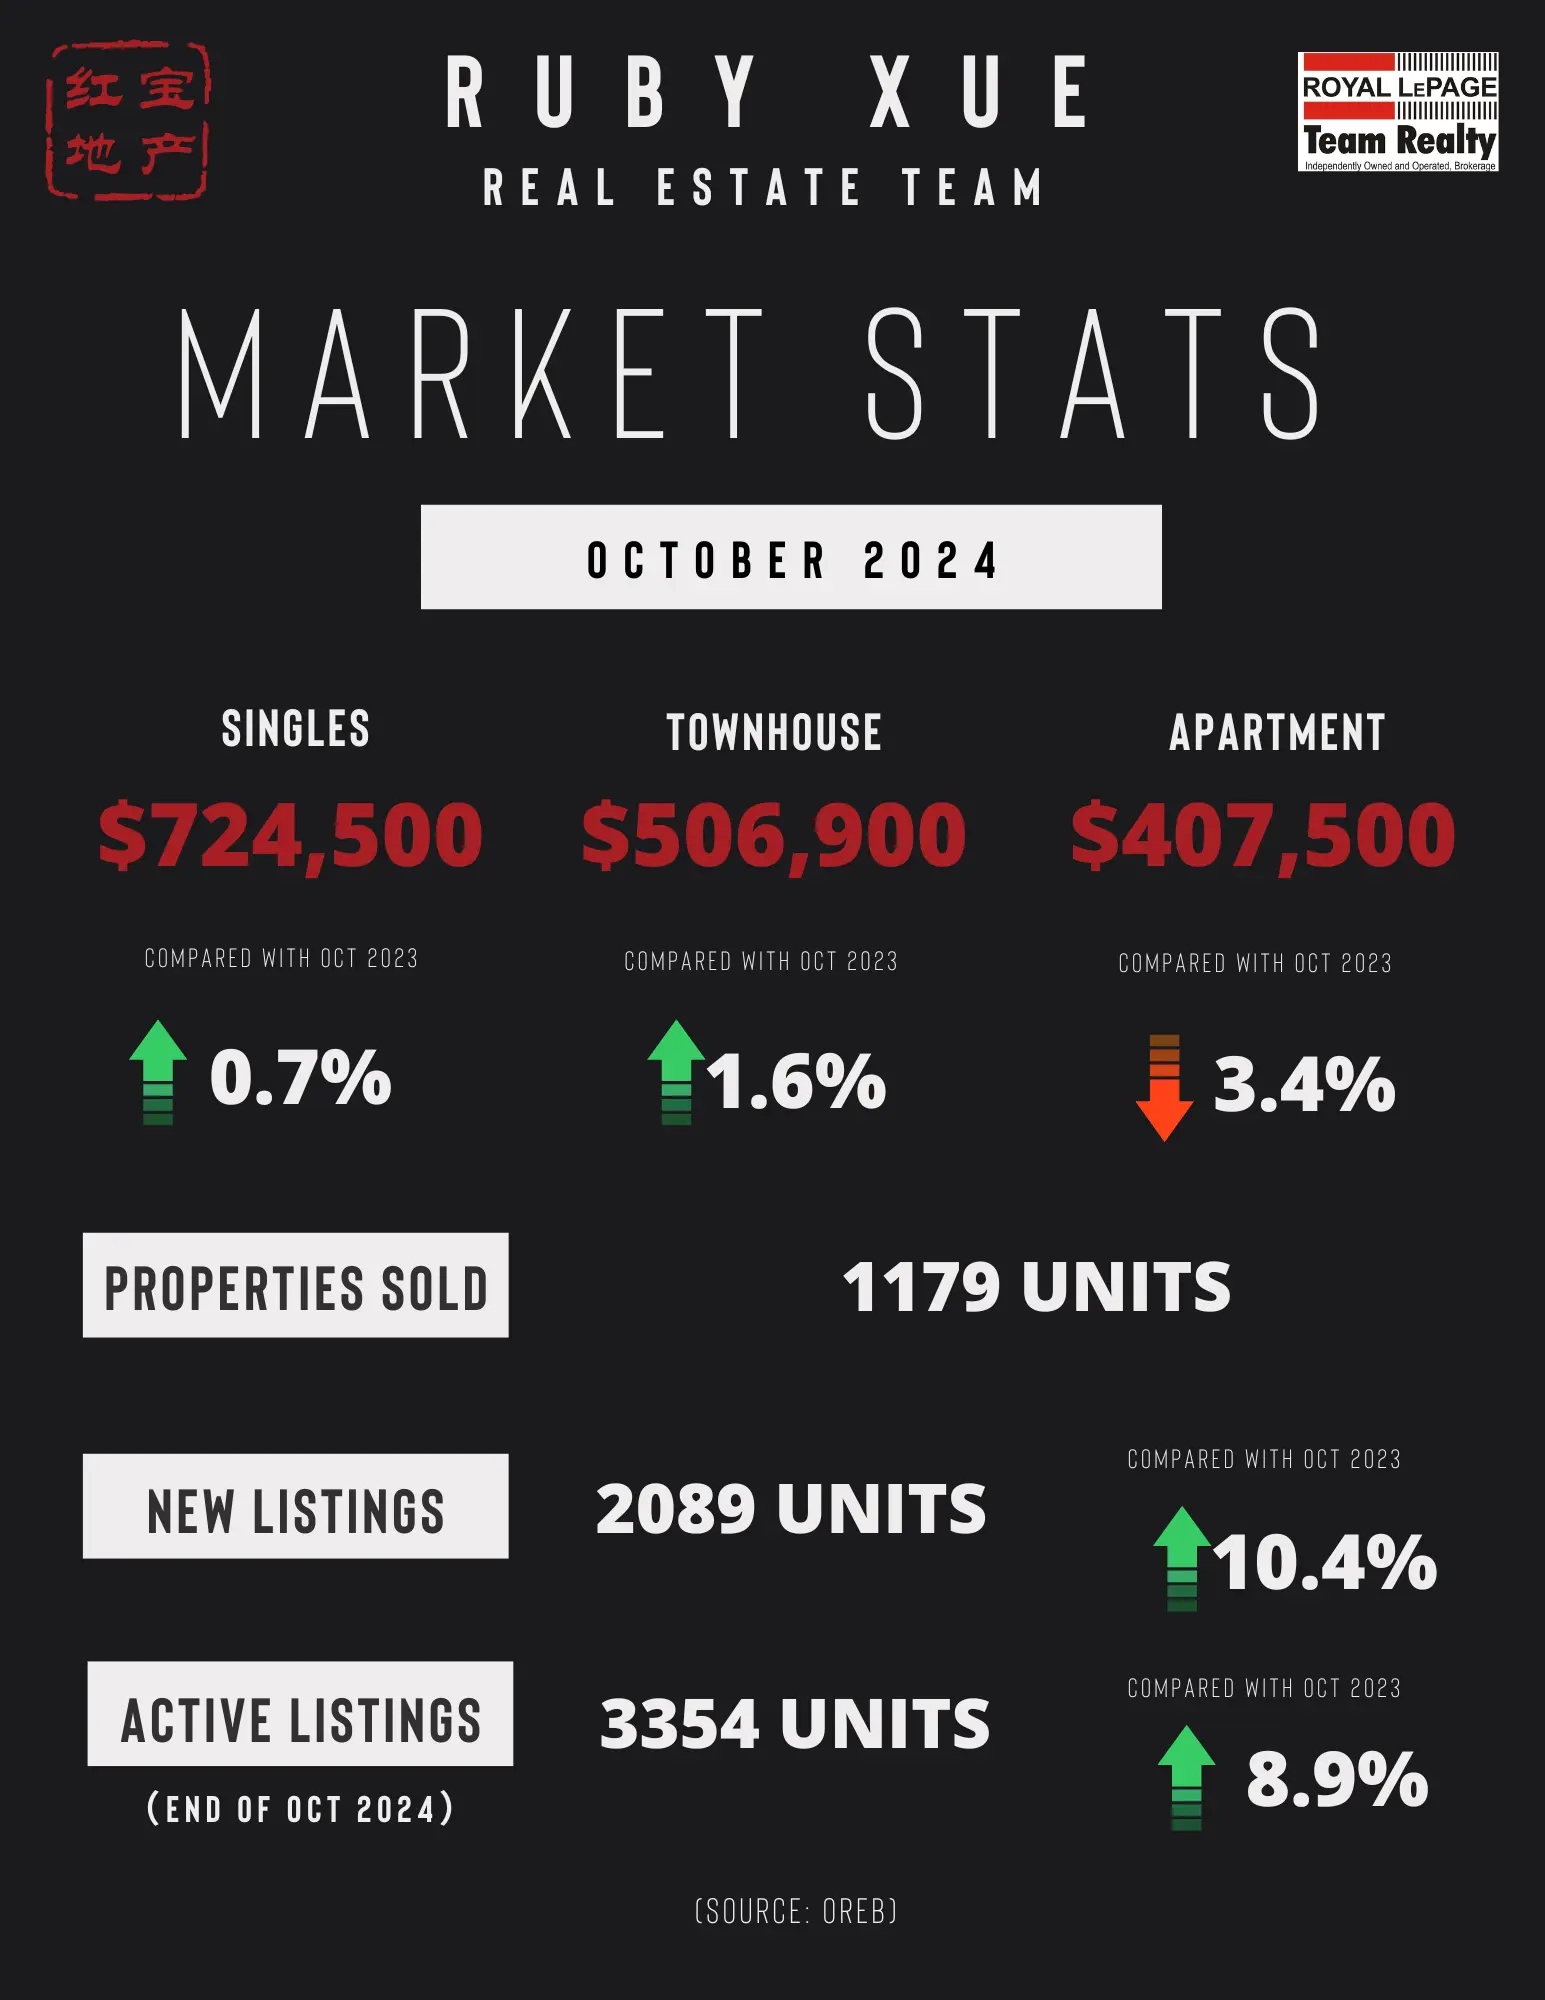
The number of homes sold through the MLS® System of the Ottawa Real Estate Board (OREB) totaled 1,179 units in October 2024 — an increase over the 1,047 units sold last month.

Home sales were 3.9% below the five-year average and 0.9% below the 10-year average for the month of October.

On a year-to-date basis, home sales totaled 11,662 units in October 2024 — an increase of 9.4% from the same period in 2023.

“We’re seeing positive movement in Ottawa’s market with sales activity up,” says OREB President Curtis Fillier. “This is especially interesting because there has been sustained activity throughout the year instead of the typical seasonal spikes and lulls. Consumer confidence is getting stronger, boosted by another consecutive Bank of Canada interest rate cut — though many are waiting for additional rate drops.”

The 50-basis-point reduction might offer optimism following Ontario’s tabling of the Fall Economic Statement where housing starts projections were scaled back to 81,300, representing another reduction in projections and is even further from the province’s goal of creating 125,000 new homes in 2024. The Ontario government cites high interest rates and a tough economic environment as pervasive challenges for homebuilders.

“The challenge remains supply,” says Fillier. “We know from experience that Ottawa’s inventory leans tight and can swing quickly from balanced territory to a seller’s market — which can compound affordability and accessibility challenges. Now is always the time for fresh action and innovative policies that can create much-needed inventory.”

OREB leaders and volunteers recently joined the Canadian Real Estate Association on Parliament Hill to present focused solutions to confront the ongoing housing supply crisis. With expertise and experience in market conditions and consumer needs, REALTORS® advocated to stimulate supply by investing in offsite construction technologies (i.e. prefabricated homes) and extending HST/GST relief for non-profit-built affordable ownership housing.

By the Numbers – Prices: 

The MLS® Home Price Index (HPI) tracks price trends far more accurately than is possible using average or median price measures. 

  • The overall MLS® HPI composite benchmark price was $639,500 in October 2024, an increase of 0.4% from October 2023.

  • The overall MLS® HPI composite benchmark price was $639,500 in October 2024, an increase of 0.4% from October 2023.

    • The benchmark price for single-family homes was $724,500, up 0.7% on a year-over-year basis in October.

    • By comparison, the benchmark price for a townhouse/row unit was $506,900, up 1.6% compared to a year earlier. 

    • The benchmark apartment price was $407,500, down 3.4% from last year.

  • The average price of homes sold in October 2024 was $668,690 increasing 1.2% from October 2023. The more comprehensive year-to-date average price was $678,081, increasing by 0.9% from October 2023.  

  • The dollar volume of all home sales in October 2024 was $788.3 million, up 47.7% from October 2023.

OREB cautions that the average sale price can be useful in establishing trends over time but should not be used as an indicator that specific properties have increased or decreased in value. The calculation of the average sale price is based on the total dollar volume of all properties sold. Prices will vary from neighbourhood to neighbourhood.  

By the Numbers – Inventory & New Listings 

  • The number of new listings saw an increase of 10.4% from October 2023. There were 2,089 new residential listings in October 2024. New listings were 6.7% above the five-year average and 17% above the 10-year average for the month of October.

  • Active residential listings numbered 3,354 units on the market at the end of October 2024, a gain of 8.9% from October 2023. Active listings were 40.6% above the five-year average and 6.7% above the 10-year average for the month of October.

  • Months of inventory numbered 2.8 at the end of October 2024, compared to 3.8 in October 2023. The number of months of inventory is the number of months it would take to sell current inventories at the current rate of sales activity.

    (SOURCE: OREB)

Read

OTTAWA REAL ESTATE - SEPTEMBER STATS (2024)

Ottawa’s MLS® Home Sales Healthy Amid a Shifting Market

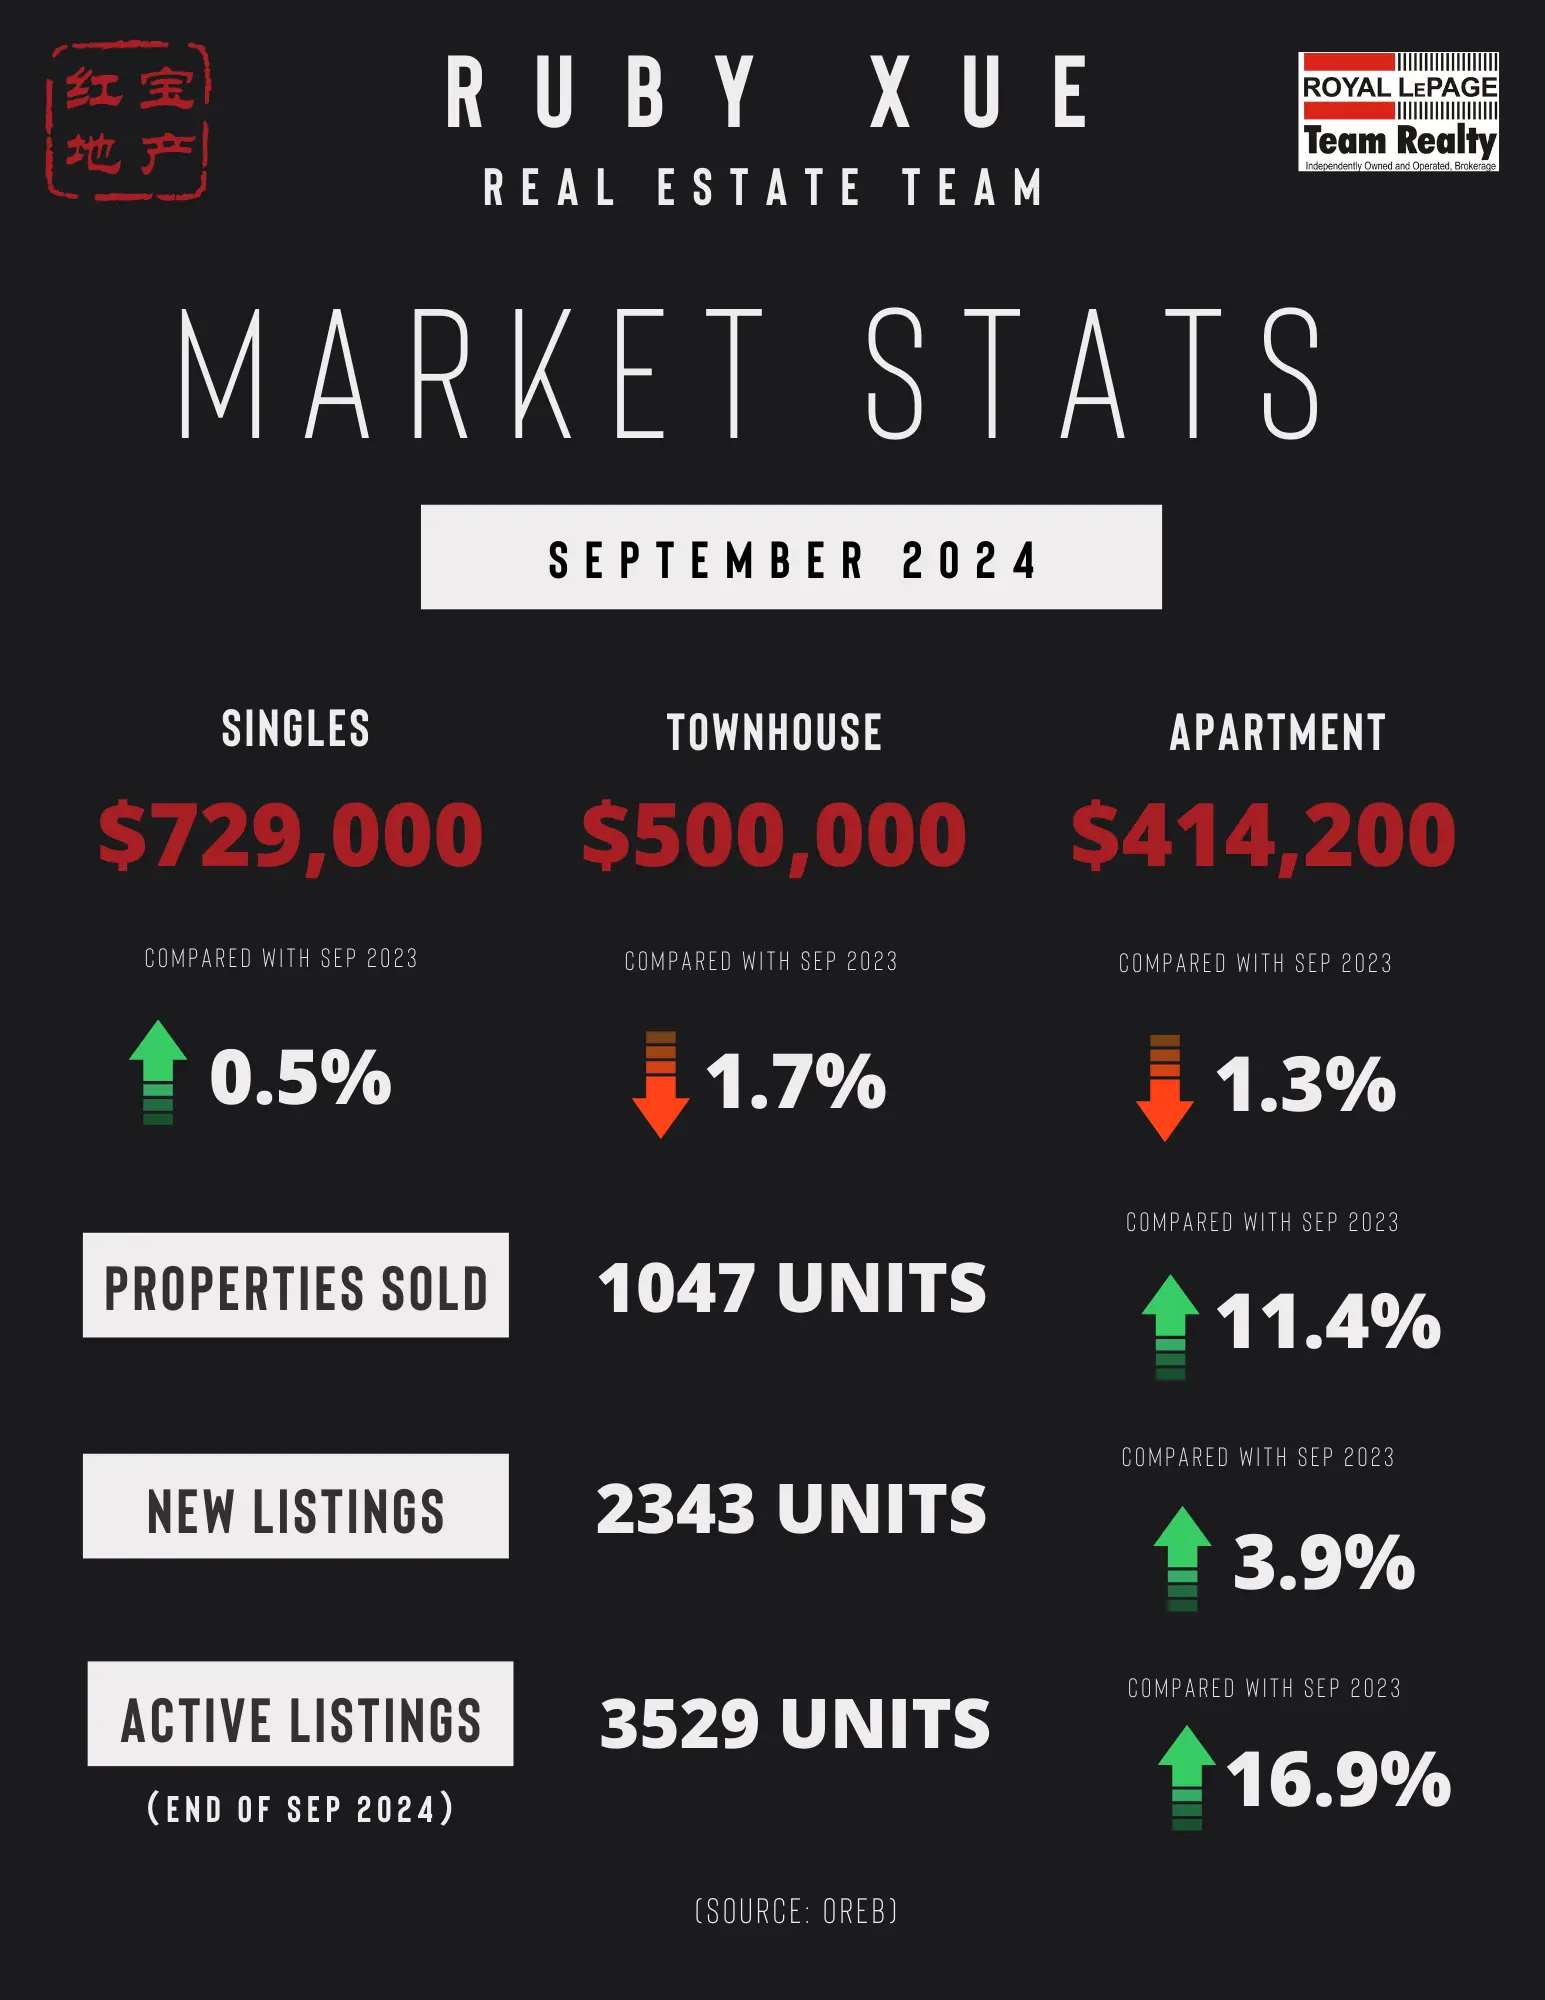
The number of homes sold through the MLS® System of the Ottawa Real Estate Board (OREB) totaled 1,047 units in September 2024. This was an 11.4% increase from September 2023.  

Home sales were 17.4% below the five-year average and 15.4% below the 10-year average for the month of September.  

On a year-to-date basis, home sales totaled 10,485 units in September 2024 — an increase of 6.4% from the same period in 2023.  

“As we navigate a shifting housing market, Ottawa’s fall outlook is healthy,” says OREB President Curtis Fillier. “Activity is robust with an uptick in sales and prices remaining steady. Meanwhile, both buyers and sellers are rethinking their purchasing power amidst news about additional interest rate cuts on the horizon, longer amortizations, and increased price caps for insured mortgages.” 

“There have been encouraging policy developments recently that will stimulate demand,” says Fillier. “But Ottawa’s market does not typically have demand problems — we have chronic supply issues. We’re not building enough homes in the city, and we’re not building enough of the right homes to address the ‘missing middle.’”  

The Canada Mortgage and Housing Corporation (CMHC) recently reported that Ottawa’s “population-adjusted construction is at its lowest level in nearly 10 years.” A City of Ottawa progress report shows that Ottawa is only at 22 per cent of its annual housing target at the end of August.  

By the Numbers – Prices: 

The MLS® Home Price Index (HPI) tracks price trends far more accurately than is possible using average or median price measures. 

  • The overall MLS® HPI composite benchmark price was $642,800 in September 2024, an increase of 0.2% from September 2023.  

    • The benchmark price for single-family homes was $729,000, up 0.5% on a year-over-year basis in September.  

    • By comparison, the benchmark price for a townhouse/row unit was $500,000, down 1.7% compared to a year earlier.  

    • The benchmark apartment price was $414,200, down 1.3% from year-ago levels. 

  • The average price of homes sold in September 2024 was $685,551 increasing 1.4% from September 2023. The more comprehensive year-to-date average price was $679,082, increasing by 0.9% from September 2023.  

  • The dollar volume of all home sales in September 2024 was $717.7 million, up 12.9% from September 2023. 

OREB cautions that the average sale price can be useful in establishing trends over time but should not be used as an indicator that specific properties have increased or decreased in value. The calculation of the average sale price is based on the total dollar volume of all properties sold. Prices will vary from neighbourhood to neighbourhood.  

By the Numbers – Inventory & New Listings 

  • The number of new listings saw an increase of 3.9% from September 2023. There were 2,343 new residential listings in September 2024. New listings were 4.7% above the five-year average and 11.6% above the 10-year average for the month of September. 

  • Active residential listings numbered 3,529 units on the market at the end of September 2024, a gain of 16.9% from September 2023. Active listings were 43.3% above the five-year average and 4.6% above the 10-year average for the month of September. 

  • Months of inventory numbered 3.4 at the end of September 2024, up from 3.2 in September 2023. The number of months of inventory is the number of months it would take to sell current inventories at the current rate of sales activity. 

    (SOURCE: OREB)

Read

OTTAWA REAL ESTATE - AUGUST STATS (2024)

Ottawa’s Hot Summer Market Expected to Extend into Fall

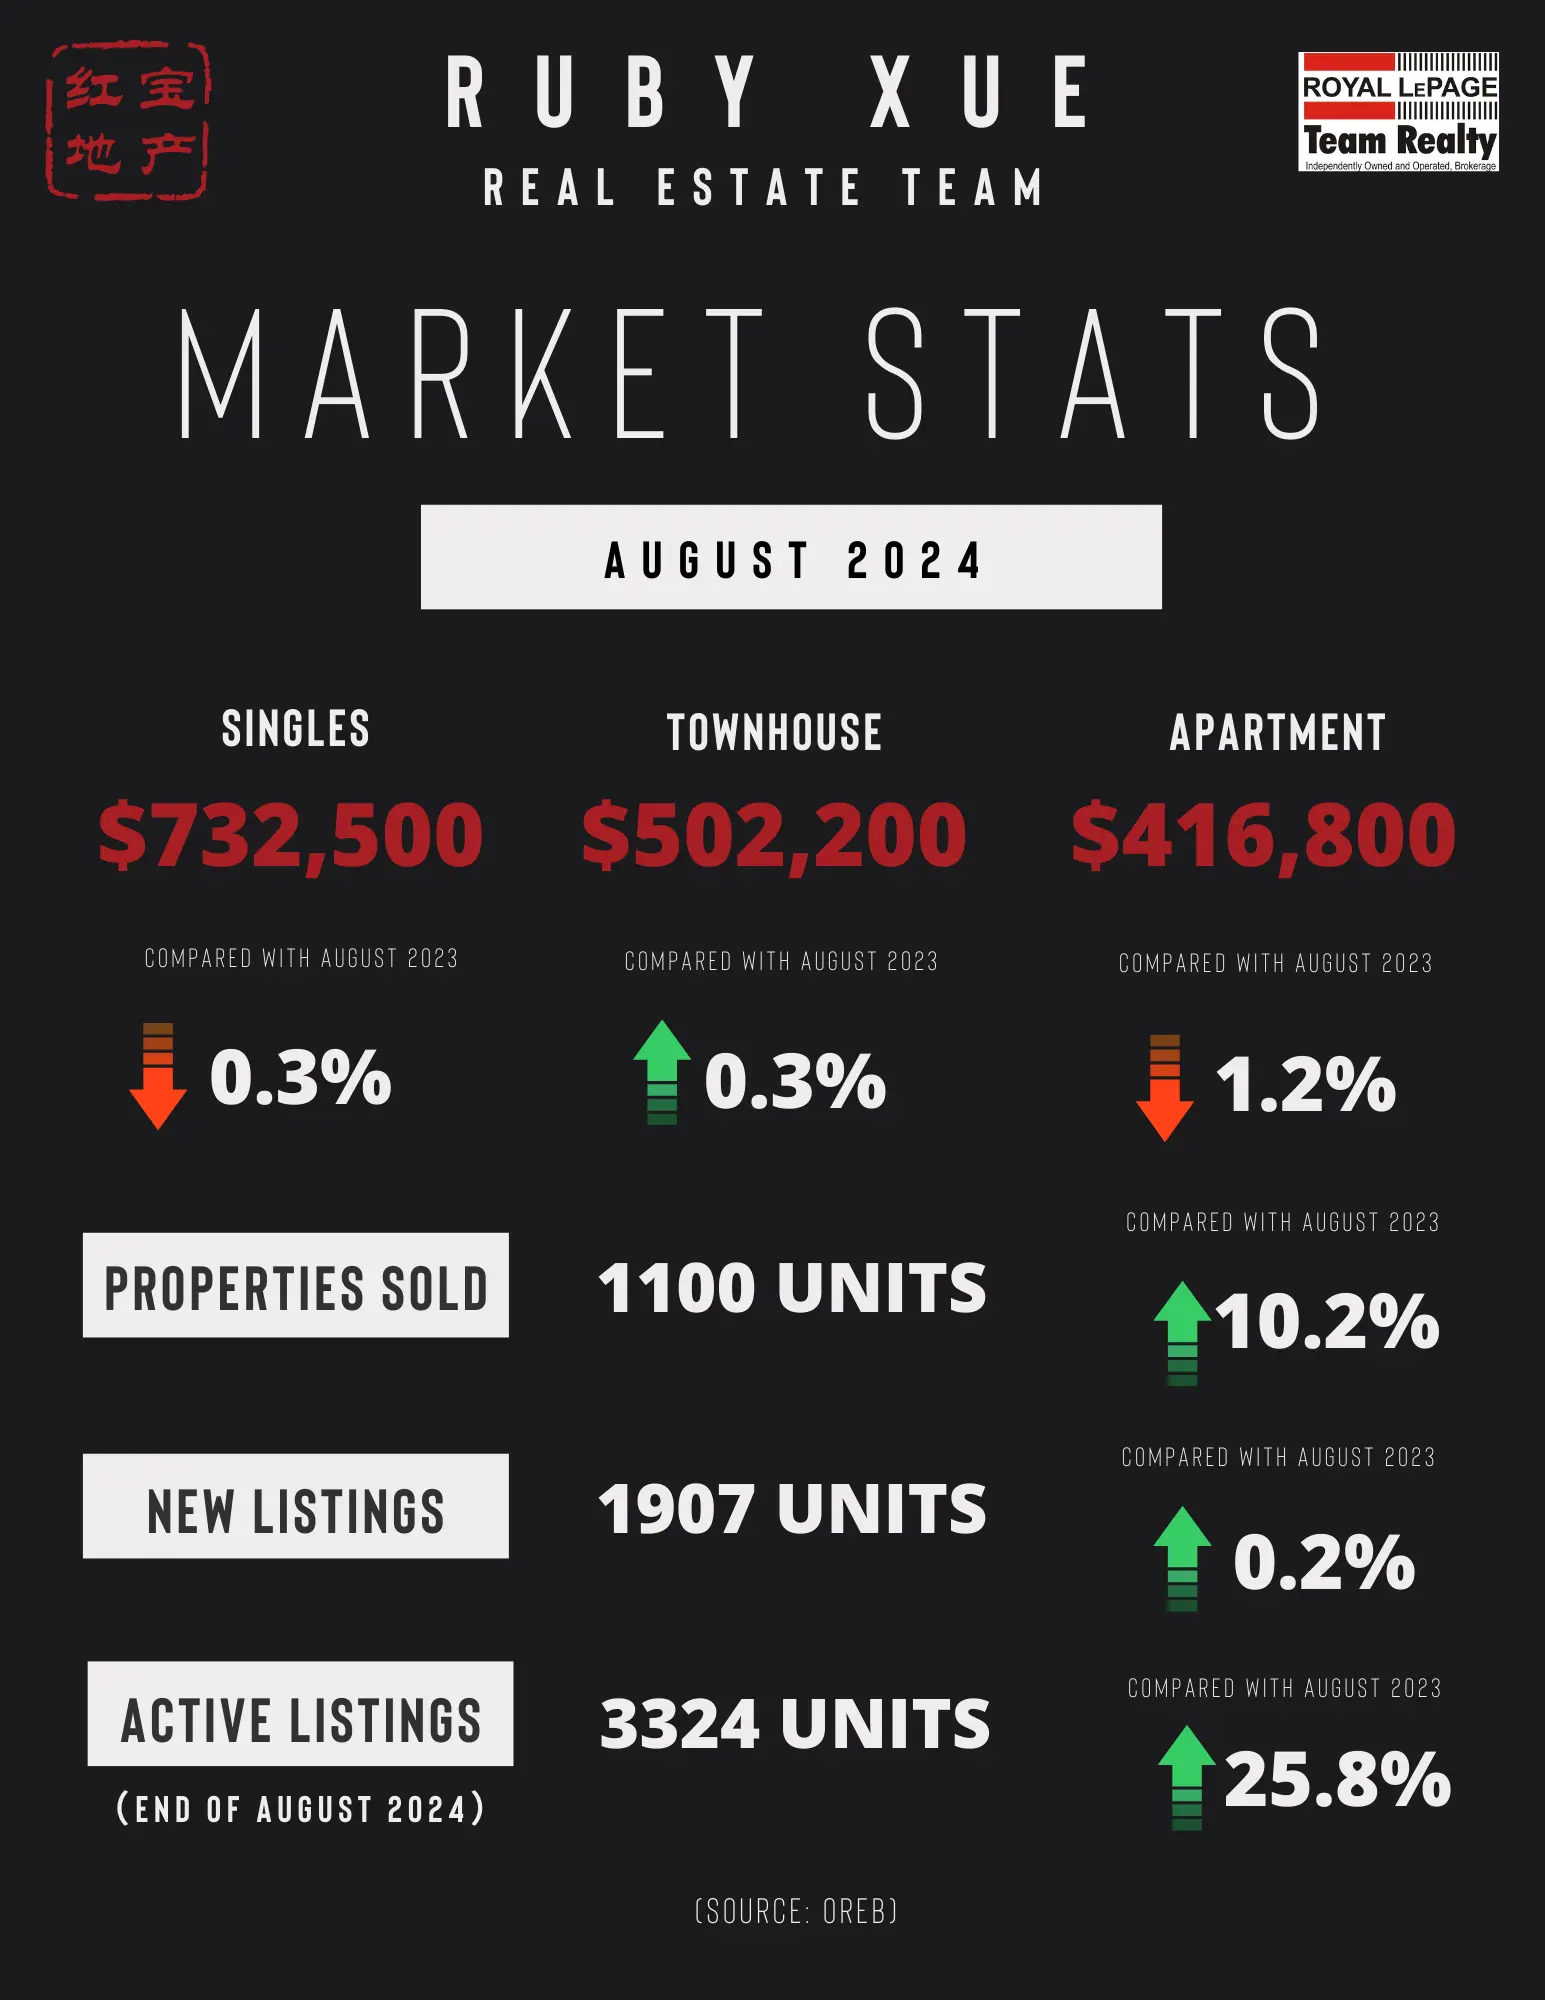
The number of homes sold through the MLS® System of the Ottawa Real Estate Board (OREB) totaled 1,100 units in August 2024. This was a 10.2% increase from August 2023.

Home sales were 11.4% below the five-year average and 14.1% below the 10-year average for the month of August.

On a year-to-date basis, home sales totaled 9,444 units in August 2024 — an increase of 6.0% from the same period in 2023.

“Being a seasonal market, it’s very encouraging to see sustained levels of activity throughout the whole summer,” says OREB President-elect Paul Czan. “And coupled with a third consecutive interest rate drop from the Bank of Canada, we are anticipating a heated market in the fall.”

“REALTORS® know firsthand how affordability remains a top concern for most buyers. With a stream of new listings hitting the market and prices holding steady, buyers are not moving with urgency. They are still using caution and taking their time to find the right property for their needs and budget. As such, sellers need to be patient and work with a REALTOR® who can use the latest neighbourhood-level data and insights to properly price their property and build a selling strategy.”

By the Numbers – Prices:

The MLS® Home Price Index (HPI) tracks price trends far more accurately than is possible using average or median price measures.

  • The overall MLS® HPI composite benchmark price was $646,000 in August 2024, a decrease of 0.3% from August 2023.

    • The benchmark price for single-family homes was $732,500, down 0.3% on a year-over-year basis in August.

    • By comparison, the benchmark price for a townhouse/row unit was $502,200, up 0.3% compared to a year earlier.

    • The benchmark apartment price was $416,800, down 1.2% from year-ago levels.

    • The average price of homes sold in August 2024 was $660,341 increasing 0.3% from August 2023. The more comprehensive year-to-date average price was $678,327, increasing by 0.9% from August 2023.

    • The dollar volume of all home sales in August 2024 was $726.3 million, up 10.5% from August 2023.

OREB cautions that the average sale price can be useful in establishing trends over time but should not be used as an indicator that specific properties have increased or decreased in value. The calculation of the average sale price is based on the total dollar volume of all properties sold. Prices will vary from neighbourhood to neighbourhood.

By the Numbers – Inventory and New Listings:

  • The number of new listings saw an increase of 0.2% from August 2023. There were 1,907 new residential listings in August 2024. New listings were 0.2% above the five-year average and 0.9% above the 10-year average for the month of August.

    • Active residential listings numbered 3,324 units on the market at the end of August 2024, a gain of 25.8% from August 2023. Active listings were 46.5% above the five-year average and 1.3% below the 10-year average for the month of August.

    • Months of inventory numbered 3.0 at the end of August 2024, up from 2.6 in August 2023. The number of months of inventory is the number of months it would take to sell current inventories at the current rate of sales activity.

(SOURCE: OREB)

Read

OTTAWA REAL ESTATE - JULY STATS (2024)

Ottawa’s MLS® Market Gains Momentum Heading into Summer

The number of homes sold through the MLS® System of the Ottawa Real Estate Board (OREB) totaled 1,241 units in July 2024. This was a 13.6% increase from July 2023.

Home sales were 7.1% below the five-year average and 8.8% below the 10-year average for the month of July.

On a year-to-date basis, home sales totaled 8,349 units in July 2024 — an increase of 5.5% from the same period in 2023.

“As the market pace typically slows in the summer, July’s activity is encouraging and could be a sign of more gains ahead,” says OREB President Curtis Fillier. “Buyer confidence is slowly but surely catching up while sellers continue to add a steady stream of new listings. Of course, the extent to which that translates into transactions depends on the type of properties and price points available in our communities as supply and affordability issues persist.”

“It’s too early to tell, but recent policy developments could be a boost,” says Fillier. “Two consecutive interest rate cuts by the Bank of Canada, coupled with the federal government’s introduction of 30-year amortization periods on mortgages for first-time homebuyers purchasing newly built homes, will help some buyers. However, these are demand policies and Ottawa — as well as many cities across the country — needs action on the supply side.”

In its Monetary Policy Report, the Bank of Canada points to municipal zoning restrictions and high development fees as long-standing standing challenges to supply growth. Recent data from the Ontario government shows Ottawa is significantly behind its housing starts goal having only built 1,593 homes out of its 12,583 target for 2024. OREB and its member REALTORS® continue to advocate for direct solutions to address the city’s housing crisis, such as allowing four units per lot and reducing costly development fees.

By the Numbers – Prices:

The MLS® Home Price Index (HPI) tracks price trends far more accurately than is possible using average or median price measures.

  • The overall MLS® HPI composite benchmark price was $648,900 in July 2024, an increase of 0.1% from July 2023.

    • The benchmark price for single-family homes was $734,700, down 0.1% on a year-over-year basis in July.

    • By comparison, the benchmark price for a townhouse/row unit was $506,100, up 3.4% compared to a year earlier.

    • The benchmark apartment price was $422,800, down 0.9% from year-ago levels.

  • The average price of homes sold in July 2024 was $679,610 decreasing 2.1% from July 2023. The more comprehensive year-to-date average price was $681,082, increasing by 1.0% from July 2023.

  • The dollar volume of all home sales in July 2024 was $843.3 million, up 11.3% from July 2023.


OREB cautions that the average sale price can be useful in establishing trends over time but should not be used as an indicator that specific properties have increased or decreased in value. The calculation of the average sale price is based on the total dollar volume of all properties sold. Prices will vary from neighbourhood to neighbourhood.

By the Numbers – Inventory & New Listings

  • The number of new listings saw an increase of 17.1% from July 2023. There were 2,231 new residential listings in July 2024. New listings were % below the five-year average and % below the 10-year average for the month of July.

  • Active residential listings numbered 3,480 units on the market at the end of July 2024, a gain of 37.0% from July 2023. Active listings were % above the five-year average and % below the 10-year average for the month of July.

  • Months of inventory numbered 2.8 at the end of July 2024, up from 2.3 in July 2023. The number of months of inventory is the number of months it would take to sell current inventories at the current rate of sales activity.

    (SOURCE: OREB)

Read
This website may only be used by consumers that have a bona fide interest in the purchase, sale, or lease of real estate of the type being offered via the website. The data relating to real estate on this website comes in part from the MLS® Reciprocity program of the PropTx MLS®. The data is deemed reliable but is not guaranteed to be accurate.