RSS

OTTAWA REAL ESTATE-JULY STATS (2026)

Ottawa Home Sales Hold Steady as New Listings Ease in July

Ottawa’s housing market held up better than usual as the spring market gave way to summer. Sales in July were virtually unchanged from a year earlier, while new listings edged lower, improving the balance between incoming supply and sales compared with June. July marked the second time in three months that new listings fell below year-earlier levels, adding to signs that the flow of new supply is beginning to moderate and balance, even as the overall number of homes available remained high relative to recent historical trends.

Sales declined 12.7% from June, compared with a median June-to-July decrease of 20.7% over the previous decade. New listings fell at a more typical seasonal pace, allowing the relationship between new supply and sales to improve.

Pricing indicators were mixed, but once again they collectively pointed to stability rather than a market-wide shift. The average sale price was 1.6% lower than in July 2025, while the median price was unchanged. This divergence suggests that the mix of homes sold contributed to the decline in the average price.

Conditions also remained segmented geographically and by type. Absorption was generally firmer in the suburban markets, while the condominium apartment market continued to experience softer conditions, particularly in the downtown core.

“July’s results point to a steady market as it moves through the typical summer slowdown,” said OREB President Tami Eades. “Sales remained close to last year’s level, while fewer new listings helped improve the balance between supply and demand. However, conditions continue to vary significantly by property type and neighbourhood, reinforcing the importance of local data and informed guidance when making real estate decisions.”

Residential Market Activity

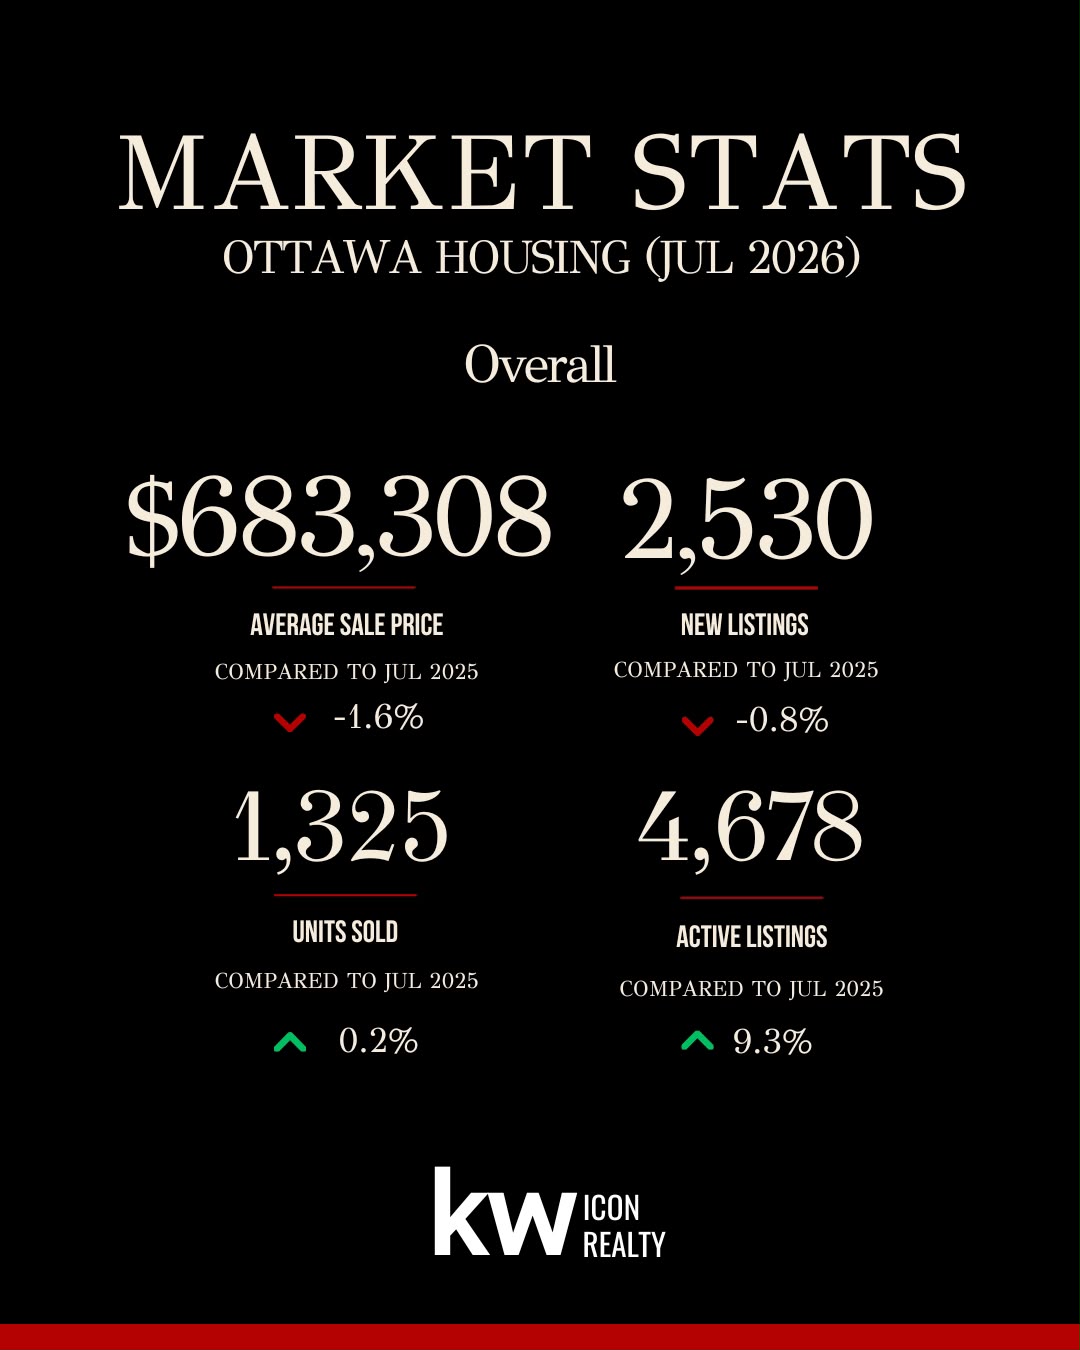
A total of 1,325 homes were sold in the Ottawa area through the MLS® System in July, an increase of 0.2% from July 2025. Although sales declined from June as the spring market gave way to summer, Ottawa retained considerably more of its spring activity than it typically has during recent June-to-July transitions.

Activity continued to vary by property type. Single-family sales rose 5.0% year-over-year to 714 transactions. Townhouse sales declined 4.1% to 417, while apartment sales declined 6.6% to 169. While Townhome and apartment sales both declined compared to 2025, that decline was once again less than the year earlier figures from June.

Year-to-date, 8,288 homes have sold in Ottawa, down 5.2% from the same period in 2025. This July result narrows the year-to-date gap from 6.1% at the end of June. Total year-to-date dollar volume was approximately $5.8 billion, down 5.6% year-over-year.

Prices and Market Balance

The average residential sale price was $683,308 in July, down 1.6% from a year earlier. The median price was unchanged at $635,000.

Taken together with other pricing measures, these figures suggest prices remained broadly stable year-over-year, and that changes in the mix of properties sold influenced the lower average. The MLS® Home Price Index, which is designed in part to adjust for changes in the mix of homes sold, recorded a composite benchmark price of $634,000, down 0.5% year-over-year but up 0.3% from June.

There were 2,530 new listings in July, down 0.8% from a year earlier. Active listings totaled 4,678, up 9.3% year-over-year but down 6.1% from June. Inventory therefore remained high compared with recent historical trends, but the growth in available supply continued to moderate.

The sales-to-new-listings ratio increased from 48.8% in June to 52.4% in July as sales held up comparatively well and fewer new properties entered the market. Months of inventory rose modestly from 3.3 in June to 3.5 in July. Although an increase is typical between June and July, this year’s 0.2-month rise was less than half the median increase recorded over the previous decade.

Other transaction measures were somewhat softer. Homes sold for an average of 97.8% of their listing price, compared with 98.0% in July 2025, while the median time on market increased from 24 to 28 days. July therefore showed improved absorption of incoming listings, but not a broad shift toward tighter market conditions.

Single-family homes remained the steadiest major segment. Months of inventory rose to 3.2, while the single-family benchmark price increased 0.6% year-over-year. Townhouses recorded 3.0 months of inventory, down from June, while the sales-to-new-listings ratio improved to 55.9%. However, the townhouse benchmark price remained 5.1% below last year. The condominium apartment market continued a yearlong trend of having the softest conditions, particularly in downtown Ottawa. Apartments recorded 5.4 months of inventory, a 41.0% sales-to-new-listings ratio and a median of 41 days on market. The apartment benchmark price was down 5.2% year-over-year.

Regional Market Comparison

In July, Ottawa’s suburban markets continued to account for most residential activity, representing more than 70% of all sales. Ottawa Suburb South stood out, with sales rising 8.0% year-over-year while new listings declined 6.6%. Its sales-to-new-listings ratio increased to 55.7%.

Ottawa Suburb West recorded the firmest absorption among the three suburban submarkets, with a sales-to-new-listings ratio of 56.2% and 3.0 months of inventory. Ottawa Suburb East also remained within balanced conditions, with a 54.3% ratio and 3.0 months of inventory.

Conditions remained softer in Ottawa Center. Sales declined 8.3% year-over-year, the sales-to-new-listings ratio was 39.6%, and months of inventory reached 5.6.

Rural results were more variable. Sales increased in Ottawa Rural South and Ottawa Rural West but declined in Ottawa Rural East. These percentage movements should be interpreted cautiously because the smaller number of transactions in rural submarkets means relatively few sales can produce substantial monthly or annual swings.

Overall, the regional data reinforces a market divided by geography as well as property type, with generally firmer suburban absorption and more supply-sensitive conditions in downtown Ottawa. These differences underscore the importance of local market knowledge and a well-prepared comparative market analysis, as citywide figures may not reflect the conditions affecting a particular neighbourhood or property type.

Looking Ahead

Spring concerns about a recession have given way to a more nuanced economic outlook. Statistics Canada reported that real GDP grew 0.3% in May, while the Bank of Canada said in July that there were clear signs economic growth had resumed during the second quarter. Growth remains modest and uncertainty remains elevated, but the backdrop heading into the fall is steadier than it appeared earlier in the year.

The Bank of Canada also held its policy rate at 2.25% in July. While national economic results should not be treated as a direct explanation for Ottawa’s July housing activity, continued growth and stable interest rates provide a more supportive backdrop for housing demand.

In June, the pace of new listings, the direction of inventory and the relative softness of the apartment market were identified as important indicators to watch. One month later, new listings have eased, active inventory has declined from its June level and the sales-to-new-listings ratio has improved. Apartment conditions, however, remain comparatively soft. The key question heading into the fall will be whether the improvement in citywide absorption continues once the market moves beyond the typical summer slowdown.

(SOURCE: OREB)
Read

OTTAWA REAL ESTATE-JUNE STATS (2026)

Ottawa Market Remains Balanced as Supply Shapes June Conditions

Ottawa’s housing market remained balanced in June, with activity easing in line with typical early-summer patterns, though trailing slightly behind 2025 activity levels. Supply remains elevated by recent years’ standards, continuing to give buyers more choice.

The impact of the elevated inventory is presenting differently by property type: single-family homes remained comparatively steady, townhomes showed more volatility, and apartment-style properties continue to be the softest segment.

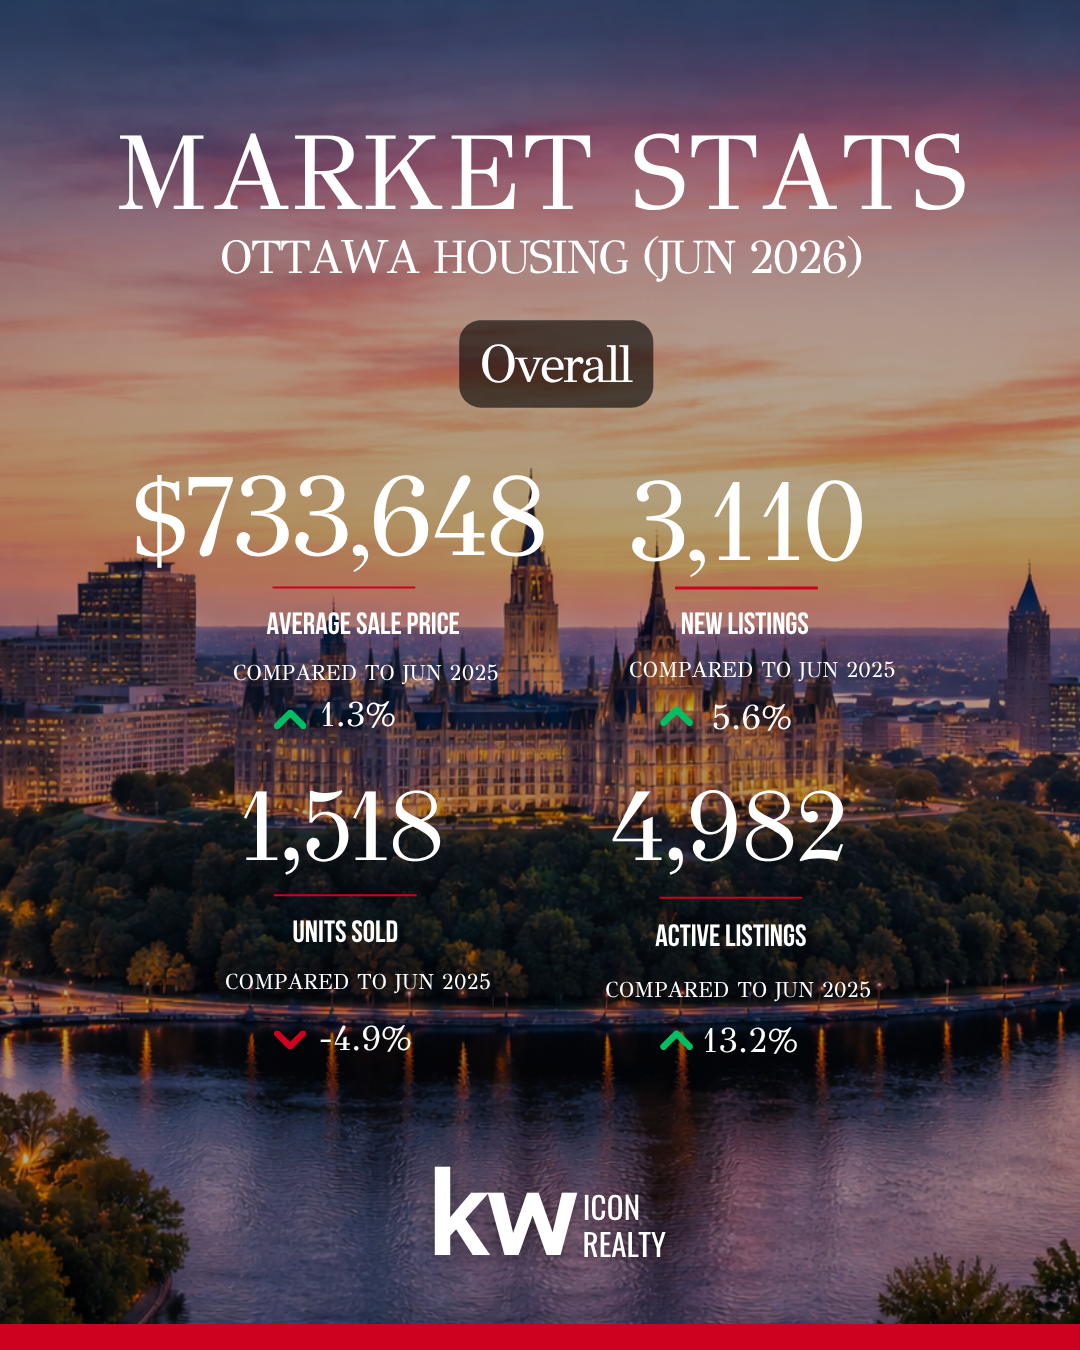
Pricing reflected that mixed picture. The average residential sale price was $733,648 in June, up 1.3% from a year earlier, while the median price was $655,000, down 1.3%.

The market continues to unfold against a cautious economic backdrop, though economic indicators are less gloomy than last month leading to some guarded optimism. The Bank of Canada held its policy rate in June, and Statistics Canada reported that real GDP grew in April after contracting in March. At the same time, uncertainty around North American trade policy continues to weigh on the broader economic outlook.

Overall, June showed a market that remains steady but is more divided beneath the surface. Supply is shaping conditions, but not overwhelming them, and the next phase of the market will depend on how well demand continues to absorb available listings across different property types.

“As we move through the summer market, the key story isn’t simply higher inventory, it’s how well demand continues to absorb that supply,” said OREB President Tami Eades. “Ottawa remains a fundamentally balanced market, but we’re seeing clear differences emerge between property types and neighbourhoods. That’s why buyers and sellers should focus less on citywide headlines and more on local market conditions. Working with a REALTOR® who understands those micro-market dynamics is more valuable than ever.”

Residential Market Activity

In June, 1,518 homes were sold through the MLS® System in Ottawa, a 4.9% decrease compared to June 2025. While sales were lower than May’s 1,616, that decline is consistent with the normal transition from the spring market into the early-summer period.

Sales activity varied by property type. Single-family homes continued to account for the largest share of activity, with 879 sales in June, down 1.8% from a year earlier. Townhouse sales totalled 429, down 7.3%, while apartment-style properties recorded 178 sales, down 14.0%.

This reinforces the property-type divide that has been building through the first half of the year: single-family demand has been steadier, while townhomes and especially apartments have carried more of the market softness.

Year to date, 6,969 homes have sold in Ottawa, down 6.1% from the same period in 2025. Total dollar volume was $4.9 billion, down 6.2% year over year. The year-to-date figures point to a market that remains active, but still below last year’s sales pace as the first half of 2026 comes to a close.

Prices and Market Balance

June’s price story was about how supply is being absorbed across different parts of the market. The average price was higher than a year ago, while the median price and benchmark measures were softer, suggesting that property mix continued to influence the headline numbers.

New listings were up year over year, active listings continued to rise, and the sales-to-new-listings ratio settled at 48.8%. Months of inventory reached 3.3, up from 2.8 last June. These figures remain consistent with balanced-market conditions.

Importantly, the additional supply has not translated into a broad weakening in transaction conditions. The sale-to-list price ratio remained at 98.5%, unchanged from June 2025, while the median days on market rose only modestly from 19 to 22 days. That suggests Ottawa is seeing more pricing discipline, not a complete shift in market conditions.

The property-type split is the clearest market-balance signal. Single-family homes remained the most stable segment, with 2.8 months of inventory and the strongest sale-to-list ratio among the major property types.

Townhomes continued to adjust as listings accumulated, with active inventory up 27.6% from last June and months of inventory rising to 3.2.

Apartment-style properties (condos) remained the softest segment, with 5.3 months of inventory and weaker benchmark pricing than the broader market.

The MLS® Home Price Index, which helps adjust for changes in the mix of homes sold, reinforced this divide. The composite benchmark price was down 1.3% year over year, with single-family down 0.7%, townhomes down 3.9%, and apartments down 6.0%.

Overall, June does not point to a market-wide price correction. It points to a balanced market where elevated supply is creating more pricing pressure, and where the clearest signs of high-supply effects remain concentrated in townhomes and apartment-style properties rather than across Ottawa as a whole.

Regional Market Comparison

Ottawa’s regional data reinforced the broader theme of a balanced but uneven market. The three suburban submarkets continued to account for most of the city’s sales activity, led by Ottawa Suburb South with 382 sales, Ottawa Suburb West with 373, and Ottawa Suburb East with 328. Together, those three areas represented more than 70% of Ottawa’s June sales.

The suburban picture was not uniform. Ottawa Suburb South recorded the highest sales total, but Ottawa Suburb West showed the firmest absorption, with the highest sales-to-new-listings ratio among the seven submarkets and the lowest months of inventory.

Ottawa Suburb East remained active, though sales were lower than last year and new listings were up, pointing to more choice for buyers.

Central and rural markets were more uneven. Ottawa Centre recorded 143 sales and had higher months of inventory than the citywide level, while Ottawa Rural East was the only submarket to post year-over-year sales growth. Rural West and Rural South had smaller transaction totals, which makes monthly movements more variable, but both continued to show more supply-sensitive conditions.

Overall, the regional data points to a market shaped by local differences rather than one broad trend. Suburban areas continue to drive most activity, but absorption, supply, and pricing conditions vary meaningfully by area.

Looking Ahead

As Ottawa moves through the summer market, the most useful signals will come less from any single month of sales and more from whether demand continues to absorb elevated supply at a steady pace. REALTORS® should be watching the sales-to-new-listings ratio, months of inventory by property type, median days on market, and whether price trends continue to diverge between single-family, townhouse, and apartment-style properties.

CMHC’s latest data adds important context to the supply story. Ottawa had 17,212 housing units under construction in May,with nearly 14,000 of those apartment units. Combined with national demographic data pointing to slower population growth and fewer non-permanent residents, there remains the possibility of an influx of apartment-style units into the market in a way that could significantly impact market conditions.

While this does not point to an immediate oversupply issue as completed and unabsorbed apartment inventory remains low with 37 apartment units reported in May; it does suggest future pressure will depend less on construction activity itself and more on whether demand continues to keep pace as projects are completed.

The rental side should also be monitored carefully. CMHC reported a 3.0% primary rental vacancy rate in Ottawa in 2025, while the condominium rental vacancy rate was much tighter at 0.6%. That means the apartment outlook is not simply a story of excess supply. It is a question of how resale demand, rental demand, investor activity, and new apartment completions interact over time.

REALTORS® in Ottawa, as always, would do well to thoroughly understand the micro-market they are operating in for their clients.

(SOURCE: OREB)

Read

OTTAWA REAL ESTATE-MAY STATS (2026)

Seasonal Activity Improves, but Ottawa’s May Market Remains Cautious

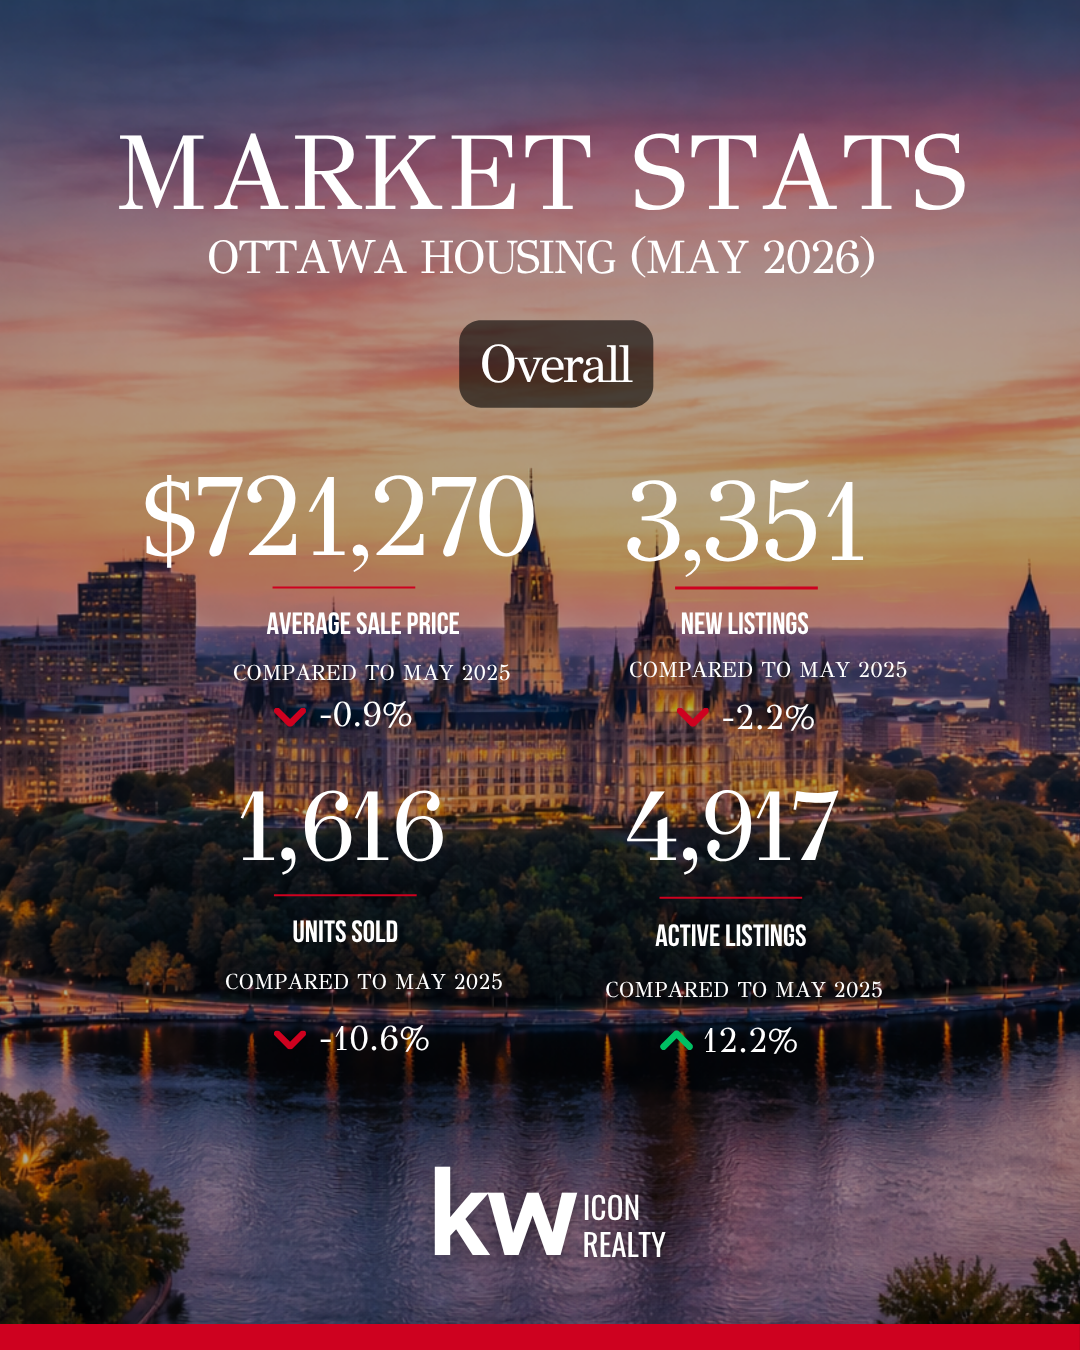
Ottawa’s housing market remained balanced in May, with activity improving from April but continuing to trail last year’s spring pace. A total of 1,616 homes sold in May, up from 1,336 in April, reflecting the typical lift as the spring market progressed. However, sales were down 10.6% compared to May 2025. These slower sales are becoming a theme thus far in 2026, even as the market remains active.

The sales-to-new-listings ratio rose to 48.2%, while months of inventory eased to 3.0, indicating demand kept better pace with new supply than it did in April. Active listings remained elevated at 4,917, keeping pressure on sellers to price strategically.

Average prices across market segments were mixed, though overall pricing remained relatively stable. Single-family home pricing was flat year over year, while average prices for townhomes and apartments saw modest declines. Overall pricing was less than one percentage point below last year’s level, indicating continued market stability. The average residential sale price was $721,270 in May, up from $712,184 in April, and relatively flat at 0.9% below May 2025. The median sale price followed a similar pattern, rising to $660,000 from $650,000 in April while remaining 1.6% lower than last May.

Performance varied by property type. Single-family homes remained resilient, with average prices essentially unchanged year over year and the median price up 1.3%. Townhomes and apartment-style properties continued to face softer conditions, with both average and median prices below last year’s levels.

The MLS® Home Price Index (HPI) composite benchmark price increased 0.9% from April but remained 0.6% below May 2025, reflecting continued variation across market segments.

Economic uncertainty continues to influence market activity. Recent GDP data has fueled discussion about Canada’s economic momentum, while the Bank of Canada has continued to take a cautious approach to interest rates. CMHC data reported lower employment levels in the first quarter compared to a year earlier, while CREA’s labour-market charts point to stronger full-time job growth and an unemployment rate that has eased from its early-2026 peak.

Ottawa’s market remains balanced, but the data also points to clear challenges. Sales continue to lag last year’s pace, inventory is elevated, and softer segments are weighing on the broader price picture. The strength of the summer market will depend on whether demand continues to absorb supply at a steady pace.

“The Ottawa market is not moving in one direction across all property types,” says OREB President Tami Eades. “May brought the seasonal increase in activity we typically expect to see in Ottawa’s housing market, but sales continue to trail last year’s pace. While economic uncertainty continues to influence consumer confidence, the key question moving into the summer market will be whether demand continues to keep pace with supply. The market remains active, but inventory levels, employment trends, and buyer confidence will all play an important role in shaping the months ahead.”

Residential Market Activity

In May, 1,616 homes were sold through the MLS® System in Ottawa, a 10.6% decrease compared to May 2025, but a clear increase from 1,336 sales in April. The month-over-month gain reflects the typical spring lift in activity, even as demand continues to trail last year’s stronger spring pace.

Sales activity was down in May compared to 2025, though the extent of that decline varied by property type. Single-family homes recorded 904 sales in May, down 8.6% from a year earlier. Townhouse sales totalled 481, down 14.3%, while apartment-style properties recorded 203 sales, down 12.1%. The segment-level results point to a market where demand remains present, but activity is trailing 2025 across all segments.

Supply remained elevated. New listings totalled 3,351 in May, down 2.2% from May 2025, while active listings rose to 4,917 units, up 12.2% year over year and above April’s 4,535 listings. While new listings did not surge this month, the elevated level of active inventory shows that supply has continued to accumulate.

The sales-to-new-listings ratio improved to 48.2%, up from 41.0% in April and consistent with balanced market conditions.

Year to date, 5,453 homes have sold in Ottawa, down 6.3% from the same period in 2025. New listings total 12,284, up 5.4%, while average active listings are up 14.8%. The year-to-date sales-to-new-listings ratio of 44.4% and 3.5 months of inventory point to a market that remains balanced overall, but one where sellers face more competition than they did last spring.

Prices and Market Balance

Price trends remained stable in May, but they were not uniform across property types. The average residential sale price in May was $721,270, down 0.9% from May 2025 but up from $712,184 in April. The median price was $660,000, down 1.6% year over year and up from $650,000 in April. Year to date, the average price is $694,539, down 0.6%, while the median price is $639,000, down 1.7%.

Single-family homes remained the most resilient segment, with an HPI benchmark price of $723,800, up 0.9% from April and 0.3% year over year. The average single-family sale price was essentially unchanged from last May, while the median price rose 1.3% to $800,000.

The townhome segment softened in May data compared to recent months. Earlier in the year, townhome activity was holding up comparatively well, but May reversed that pattern. Townhouse sales fell 14.3% year over year, pulling year-to-date sales 2.8% below 2025. Pricing has not fallen sharply month over month, with the townhouse HPI benchmark at $557,500, down 0.4% from April and 3.2% from last May. The larger signal is softer absorption, as active listings remain elevated and months of inventory sit well above last year’s level.

Apartment-style properties continued to show the most pronounced pressure. The apartment benchmark price was $385,500, up 1.5% from April but down 6.7% from May 2025. Average and median apartment prices were also lower year over year. This weakness is not unique to Ottawa; Toronto’s condo sector has also been affected by weaker investor demand and higher carrying costs. Ottawa’s apartment segment, however, should still be understood within local conditions: the data points to a slower, more price-sensitive segment, not a broad market correction.

Months of Inventory:

  • Single-Family: 2.7

  • Townhome: 2.7

  • Apartment: 4.8

Ottawa is not experiencing broad-based price growth, but neither is the market showing a uniform decline in price. Single-family homes continue to provide support, townhomes are adjusting, and apartment-style properties remain the softest part of the market. For sellers, accurate pricing remains critical; for buyers, the data points to a market where patience and property-specific analysis matter more than broad assumptions about Ottawa as a whole.

Regional Market Comparison

Ottawa’s regional picture was uneven in May, reinforcing that the citywide market is not moving as one single market. The central market and Ottawa Rural West were the only subareas to record year-over-year sales gains, while the suburban areas continued to drive most of the overall activity.

Ottawa Centre had the clearest positive activity signal, with sales up 13.5% from May 2025 and prices also higher year over year. This suggests stronger engagement in the central market after a softer start to the year, though the area’s varied property mix means monthly price movements should be interpreted with some caution.

The suburban markets remained the core of Ottawa’s sales activity, but the story differed by area. Ottawa Suburb West recorded the highest sales total and the lowest months of inventory, pointing to relatively stronger absorption. However, prices were lower than last May, so its strength was more about activity than price growth. Ottawa Suburb South remained steady but softer than last year, while Ottawa Suburb East saw a sharper decline in sales even as prices moved higher.

Rural markets were more variable, which is typical given smaller transaction volumes. Ottawa Rural West was the relative bright spot, with sales slightly above last May, while Ottawa Rural East and Rural South both recorded weaker activity. Rural East also had the highest inventory level among the subareas, pointing to slower absorption.

Overall, the regional data points to a market shaped by local differences rather than one broad trend. Central Ottawa improved in May, the west remained active, and rural conditions were more uneven. For buyers and sellers, neighbourhood, property type, and local competition continue to matter more than the citywide averages alone. Detailed regional tables are available in the non-HPI report included in the monthly stats package.

Looking Ahead

As Ottawa moves into the summer market, the most useful signals will come less from broad forecasts and more from whether demand continues to absorb supply at a steady pace. REALTORS® should be watching the sales-to-new-listings ratio, months of inventory by property type, median days on market, sale-to-list ratios, and whether benchmark prices continue to diverge between single-family, townhouse, and apartment-style properties.

CMHC’s latest construction data adds important context. Housing starts were lower year over year across all dwelling types in April, but the pipeline is shifting in composition. Rental projects accounted for 61% of starts by market type, while apartments made up most new starts and the large majority of units currently under construction. That changing mix will matter most for apartment-style resale pricing, investor demand, and rental-market competition as projects move toward completion.

Completed and unabsorbed inventory should also be monitored closely. CMHC’s April data shows this inventory has risen, with the largest concentration in row and single-detached homes. For REALTORS®, absorption of newly completed units will be an important companion indicator to resale inventory, especially in segments where pricing has already become more sensitive.

Taken together, the indicators to watch are clear: resale inventory, new listings, absorption of completed new homes, the apartment-heavy construction pipeline, and local employment conditions. These will offer a better read on Ottawa’s next phase than any single month of sales or pricing data alone.

(SOURCE: OREB)

Read

渥太华房价【红宝地产】2025.4月房市数据报告

渥太华房地产市场在不确定性减少中持续升温

根据渥太华房地产委员会(OREB)MLS®系统的数据,2025年4月共有1,306套房屋成交。与2025年3月相比增长了18.4%,但较2024年4月下降了11.2%。

就4月份而言,房屋销售量比过去五年平均水平低17.6%,比十年平均水平低16.2%。

“虽然4月的成交量同比下降,但月度增长显著,这预示着春季市场正在积蓄动能,”OREB主席Paul Czan表示。“当前的房源库存相比往年处于更高水平,说明市场正逐步朝向供需平衡迈进。”

Czan补充道:“在联邦大选尘埃落定后,买家信心逐渐恢复,但他们依然谨慎出手,花更多时间做决定,增加条件条款,并更加挑剔。与此同时,卖家也开始适应市场上架时间变长的现实,这使得合理定价和精心准备房屋变得尤为关键。如果挂牌价格合理、展示得当,房子依然能快速成交,甚至引发多方竞价。展望未来,我们将关注联邦政府近期的住房承诺如何落实。鼓励住房供应、提升可负担性、支持首次购房者的政策,是在渥太华带来实际影响的重要一步。”

数据一览——房价情况:

  • 2025年4月,MLS®综合基准房价为$631,200,比2024年4月上涨1.1%。

  • 独立屋的基准价格为$703,200,同比上涨1.0%。

  • 镇屋/排屋的基准价格为$440,000,较去年上涨4.4%。

  • 公寓基准价格为$404,000,较去年下降2.8%。

  • 2025年4月所有成交房屋的平均售价为$707,180,较2024年4月上涨0.4%。

  • 4月所有房产成交的总金额为9.235亿加元,同比下降10.8%。

OREB提醒:虽然平均售价可用来观察长期趋势,但不能直接反映具体房产价值的升降。平均售价是根据所有成交房产的总金额计算得出,不同社区的价格差异较大。

数据一览——库存与新挂牌:

  • 2025年4月新增挂牌住宅2,589套,比2024年4月下降3.8%。这一数据比五年平均高出2.8%,比十年平均高出5.6%。

  • 截至4月底,活跃挂牌住宅总数为4,878套,比2024年4月大幅增长54.2%。活跃挂牌量比五年平均高出86.9%,比十年平均高出51.3%。

  • 2025年4月的库存月数为3.7个月,而2024年4月为2.2个月。库存月数指按当前销售速度,消化完市场上现有房源所需的时间。

(数据来源:渥太华地产局OREB)

Read

OTTAWA REAL ESTATE - APRIL STATS (2025)

Momentum Builds in Ottawa’s Housing Market Amid Greater Certainty

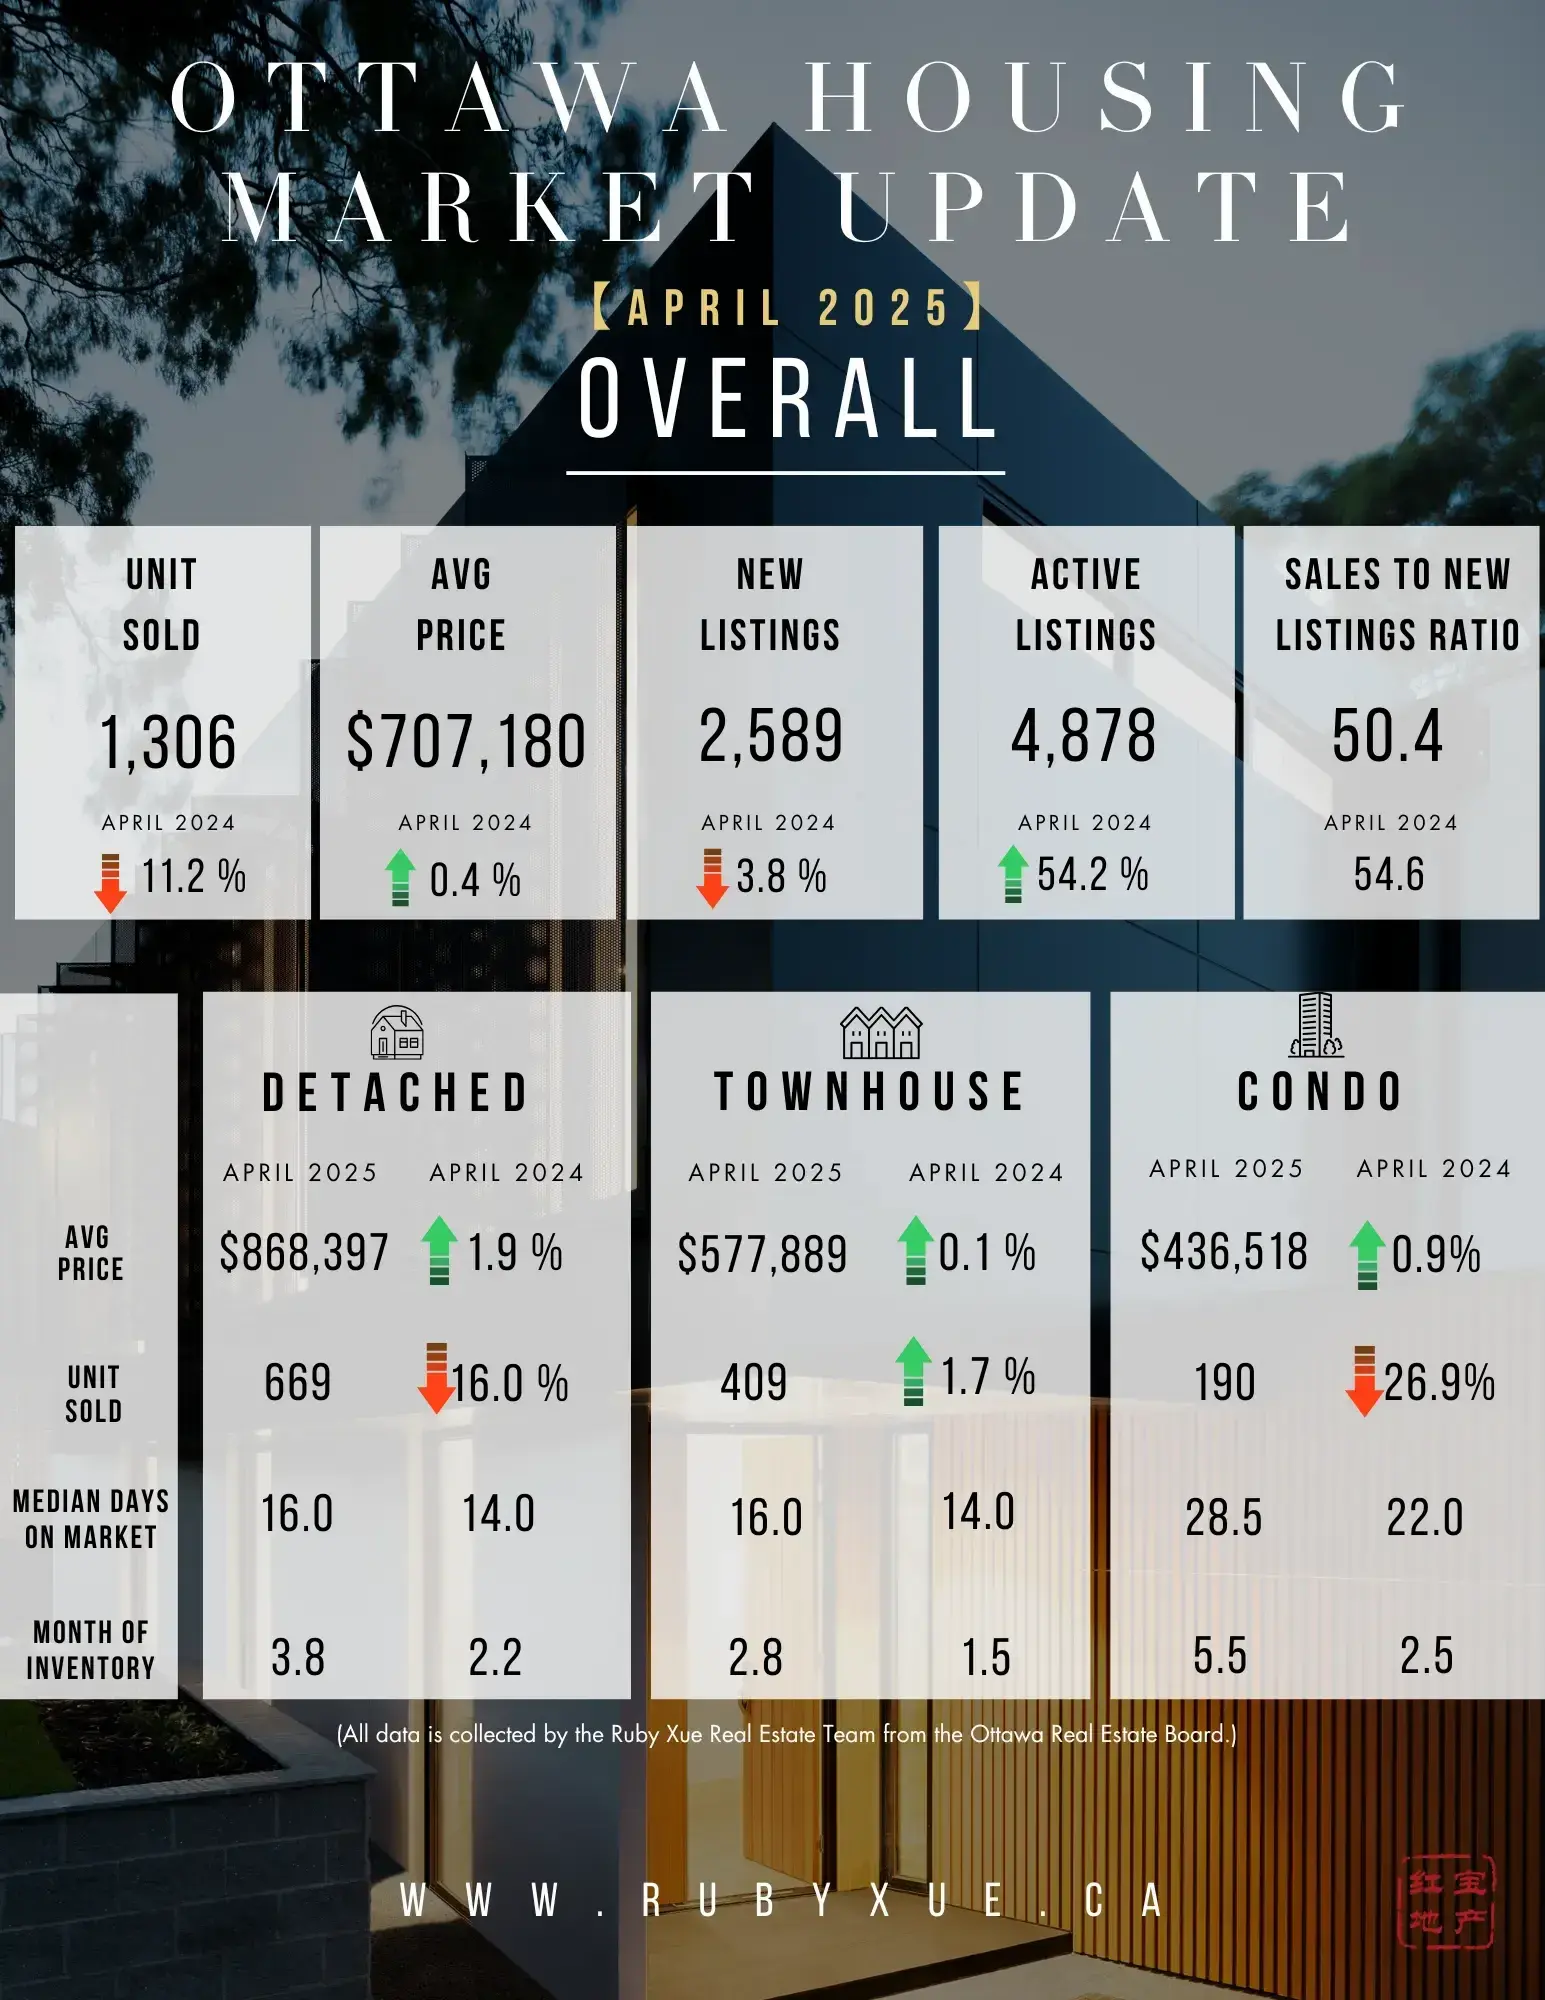
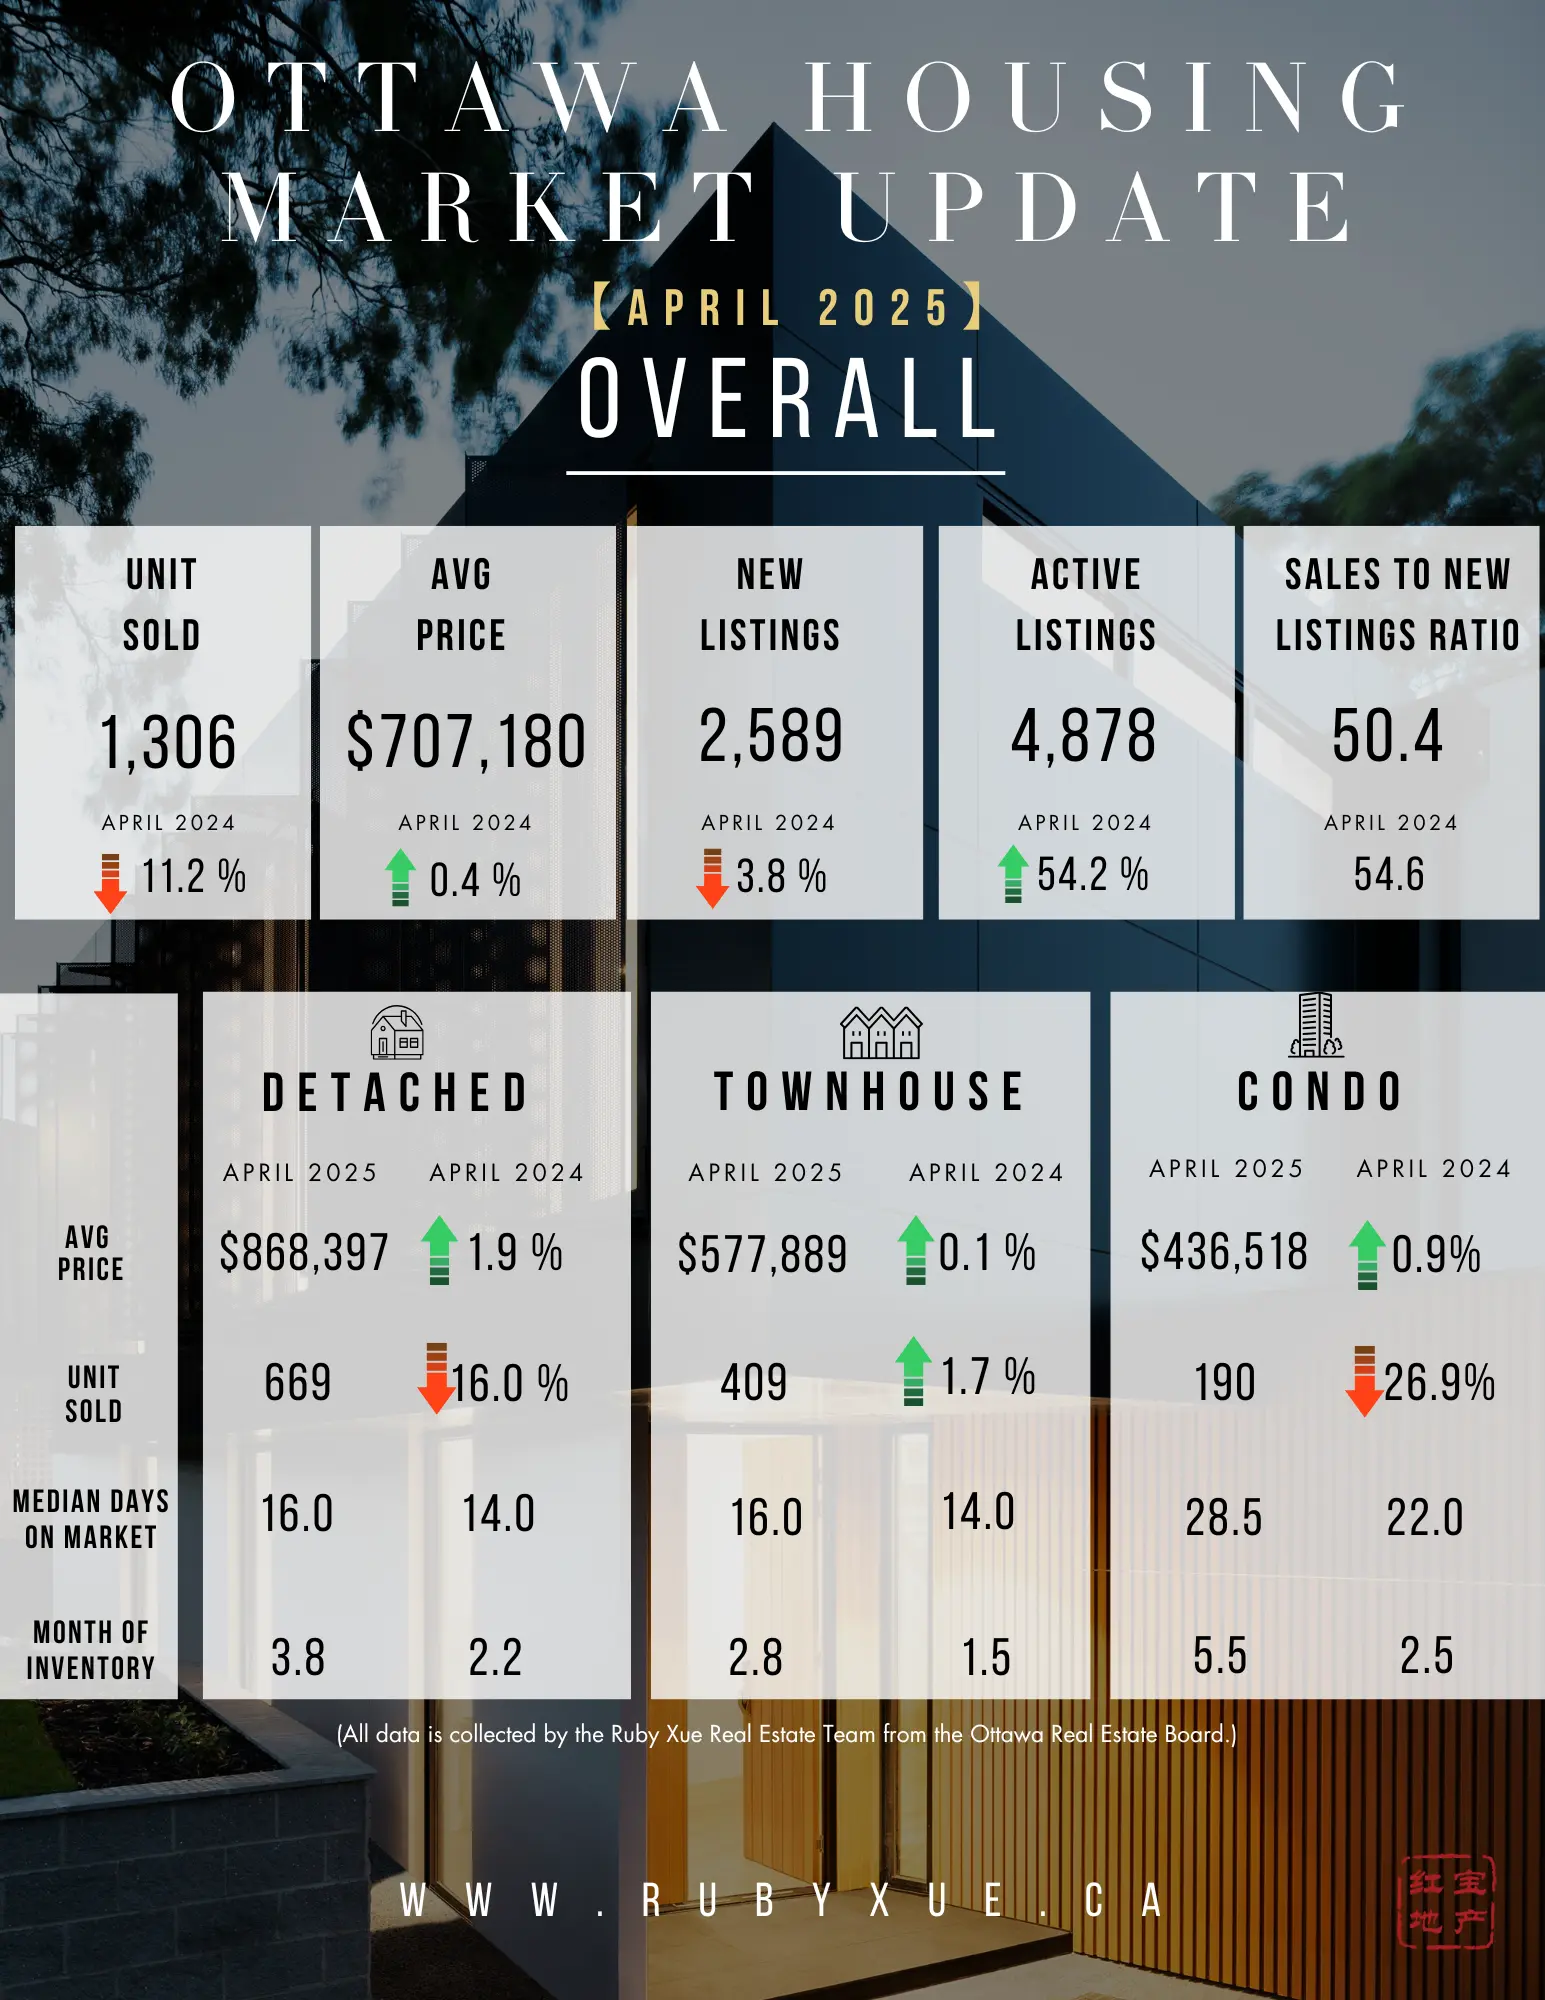
The number of homes sold through the MLS® System of the Ottawa Real Estate Board (OREB) totaled 1,306 units in April 2025. This represented an 18.4% increase from March 2025, but an 11.2% decline from April 2024.

Home sales were 17.6% below the five-year average and 16.2% below the 10-year average for the month of April.

“While April sales were down year-over-year, we saw a healthy month-over-month increase—an encouraging sign of growing momentum as we move through the spring market,” says OREB President Paul Czan. “Inventory remains at higher levels compared to previous years, indicating a gradual move towards a balanced market.”

“With more certainty following the federal election, buyers are returning with greater confidence—but they’re proceeding cautiously, taking their time, including conditions in their offers, and being more selective,” adds Czan. “Sellers, meanwhile, are adjusting to longer days on market, which makes strategic pricing and thoughtful home preparation more important than ever. If the listing is priced well, shows well, it’s moving—possibly getting multiple offers. Looking ahead, we’ll be watching how the federal government’s recent housing commitments translate into action. Policies aimed at increasing supply, improving affordability, and supporting first-time buyers are welcome steps toward meaningful impact here in Ottawa.”

By the Numbers – Prices:

  • The overall MLS® HPI composite benchmark price was $631,200 in April 2025, a 1.1% rise compared to April 2024.

    • The benchmark price for single-family homes was $703,200, up 1.0% year-over-year in April.

    • By comparison, the benchmark price for a townhouse/row unit was $440,000, an increase of 4.4% from 2024.

    • The benchmark apartment price was $404,000, a 2.8% decline from the previous year.

  • The average price of homes sold in April 2025 was $707,180, a 0.4% increase from April 2024.

  • The total dollar volume of all home sales in April 2025 amounted to $923.5 million, a 10.8% drop compared to the same period last year.

OREB cautions that the average sale price can be useful in establishing trends over time but should not be used as an indicator that specific properties have increased or decreased in value. The calculation of the average sale price is based on the total dollar volume of all properties sold. Prices will vary from neighbourhood to neighbourhood.

By the Numbers – Inventory & New Listings:

  • The number of new listings declined by 3.8% compared to April 2024, with 2,589 new residential properties added to the market. New listings were 2.8% above the five-year average and 5.6% above the 10-year average for the month of April.

  • Active residential listings totaled 4,878 units at the end of April 2025, reflecting a 54.2% surge from April 2024. Active listings were 86.9% above the five-year average and 51.3% above the 10-year average for the month of April.

  • Months of inventory stood at 3.7 at the end of April 2025, compared to 2.2 in April 2024. The number of months of inventory is the number of months it would take to sell current inventories at the current rate of sales activity.

    (SOURCE: OREB)

Read

渥太华房价【红宝地产】2025.3月房市数据报告

渥太华房地产市场在春季升温中表现稳定

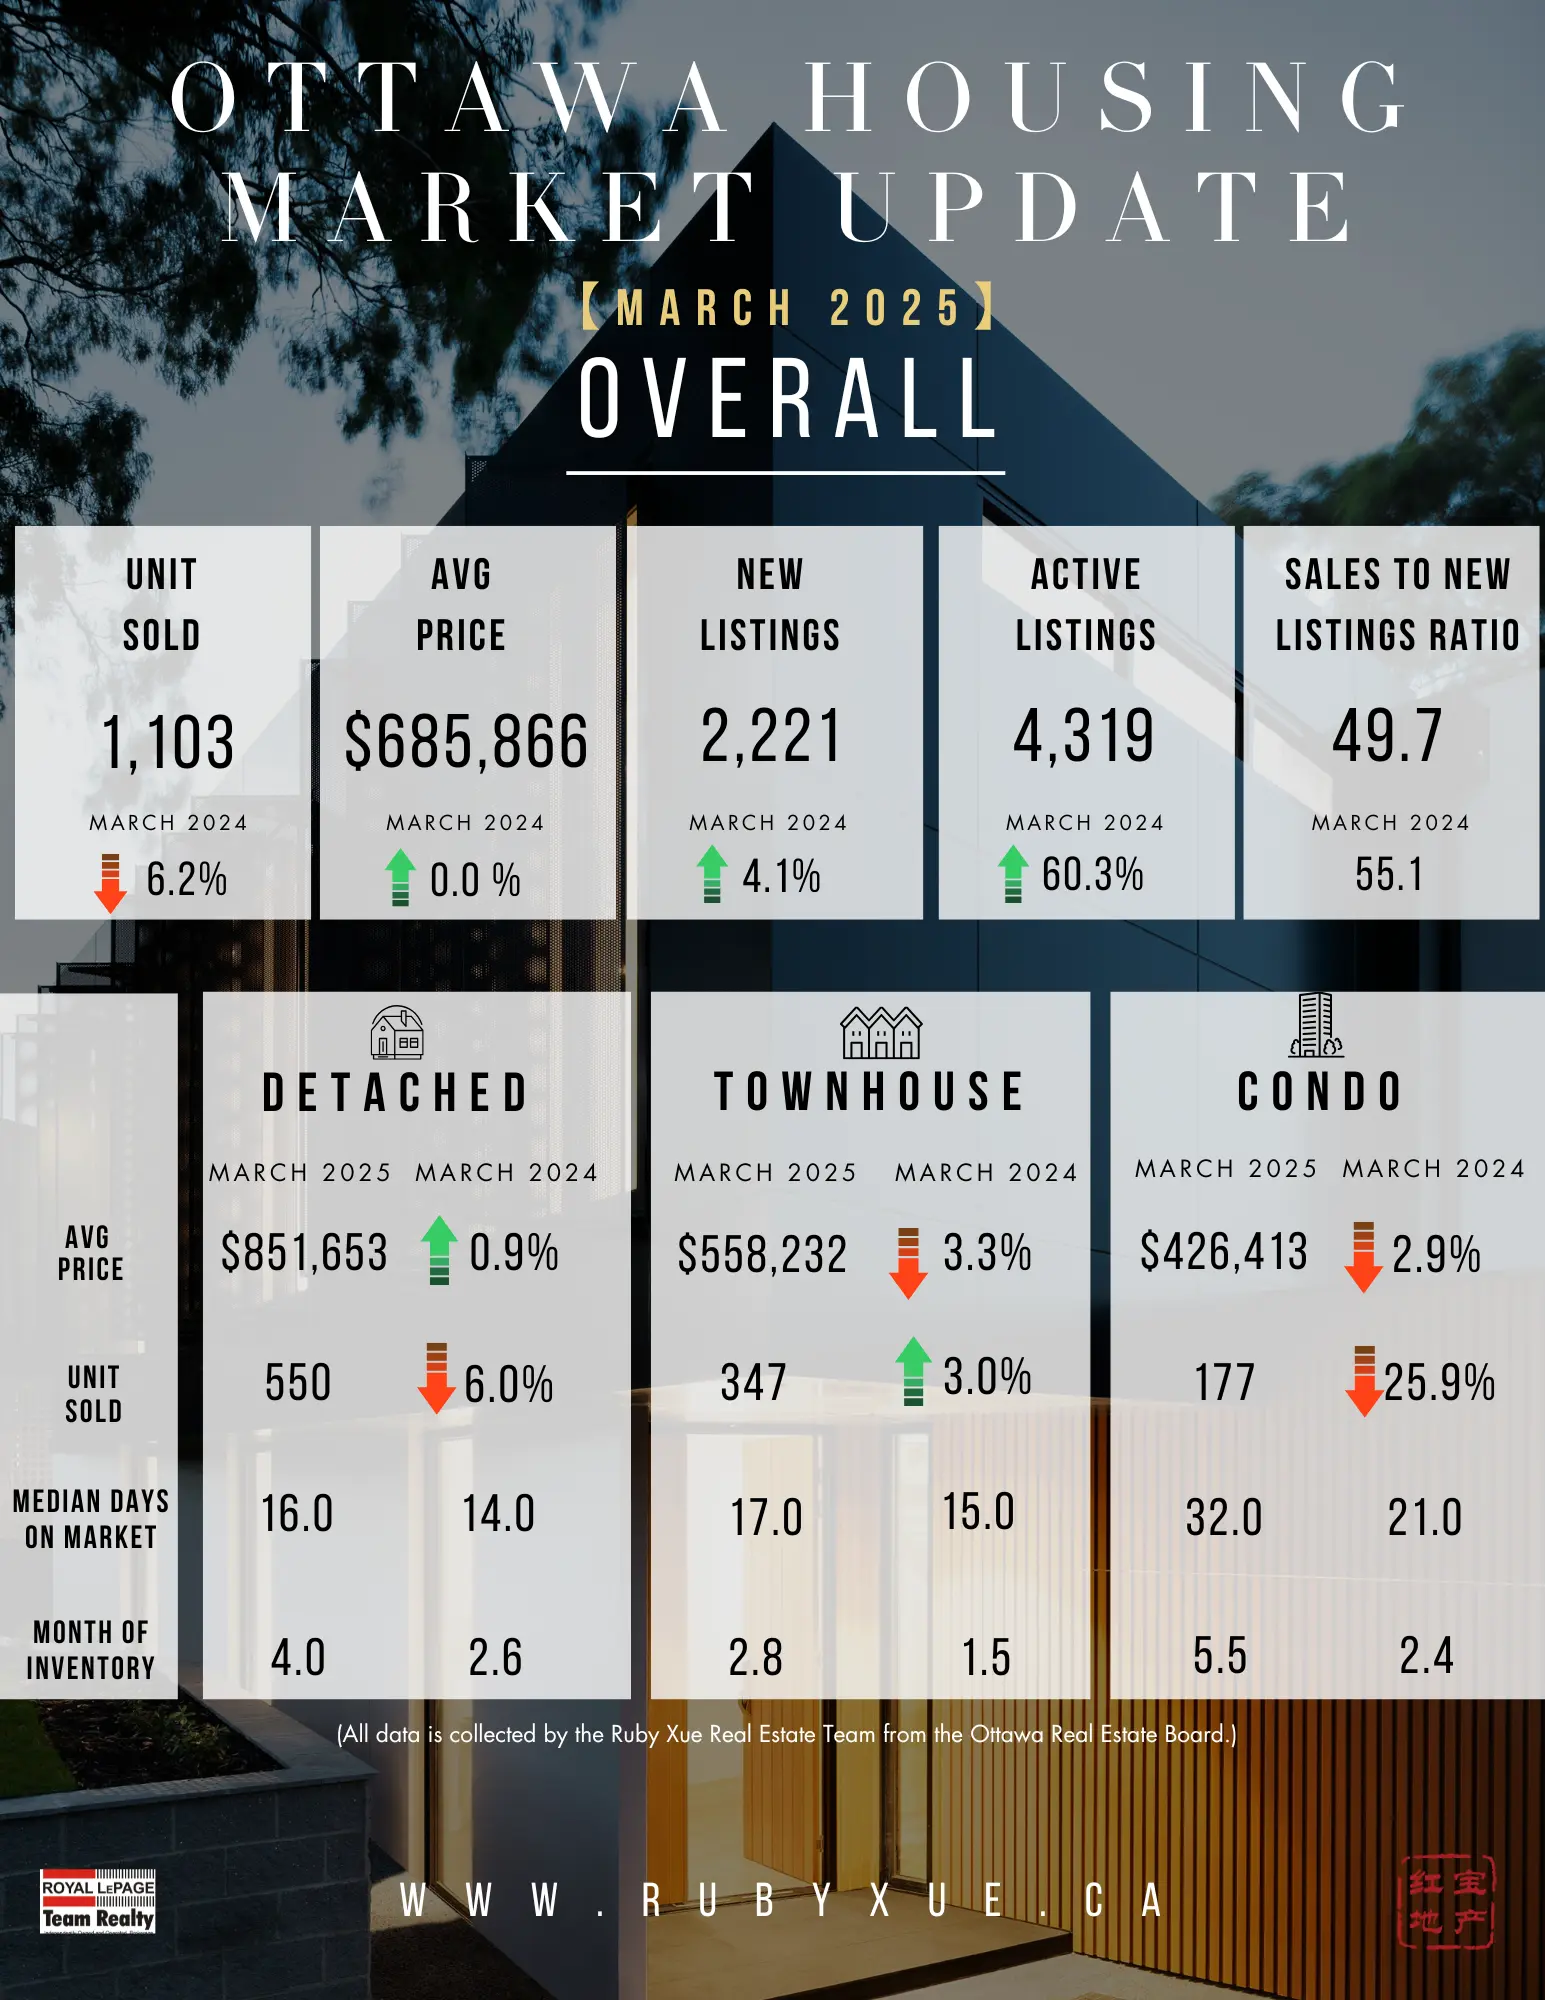
根据渥太华地产局(OREB)通过MLS®系统统计的数据,2025年3月渥太华共售出1,103套住宅。这一数字较2024年3月下降了6.2%。

3月份的房屋销售量比过去五年平均水平低24%,比过去十年平均水平低19.3%。

“2025年3月的渥太华房地产市场总体保持相对稳定,虽然成交量略低于去年同期,”渥太华地产局主席Paul Czan表示。“不过,随着春季市场的逐步升温,我们观察到月度成交量呈现持续增长的势头。买家和卖家在当前经济不确定性和即将到来的大选背景下都较为谨慎,但较低的利率正鼓励更多人走出观望。”

Czan补充道:“展望未来,当前的贸易和关税问题可能会影响新屋建设,进一步加剧供应挑战。因此,渥太华市政府与关键利益相关方的持续合作至关重要。我们很高兴能参与关于拟议中的新分区附例(New Zoning By-Law)的讨论,该附例优先考虑增加住房选择和为市民提供更多居住机会。”

房价:

  • 2025年3月,MLS® HPI 综合基准价格为626,200加元,较2024年3月上涨2.2%。

  • 独立屋的基准价格为698,700加元,同比上涨2.7%。

  • 联排别墅/排屋的基准价格为431,200加元,同比下降8.0%。

  • 公寓的基准价格为400,900加元,同比下降4.3%。

  • 2025年3月的住宅平均成交价格为685,866加元,与2024年3月持平。

  • 2025年3月总销售额为7.565亿加元,较去年同期下降6.2%。

库存与新挂牌:

  • 新挂牌数量比2024年3月增加了4.1%,共有2,221套住宅新上市。该数字比五年平均水平低0.7%,比十年平均水平低2.2%。

  • 截至2025年3月底,市场上共有4,319套活跃挂牌住宅,比2024年3月大幅增长60.3%。该库存量比五年平均高出92.7%,比十年平均高出49.5%。

  • 2025年3月底的库存月数为3.9个月,高于2024年3月的2.3个月。库存月数是指以当前销售速度消化完市场库存所需的时间。

(数据来源:渥太华地产局OREB)

Read

OTTAWA REAL ESTATE - MARCH STATS (2025)

Ottawa Housing Market Shows Stability as Spring Momentum Builds

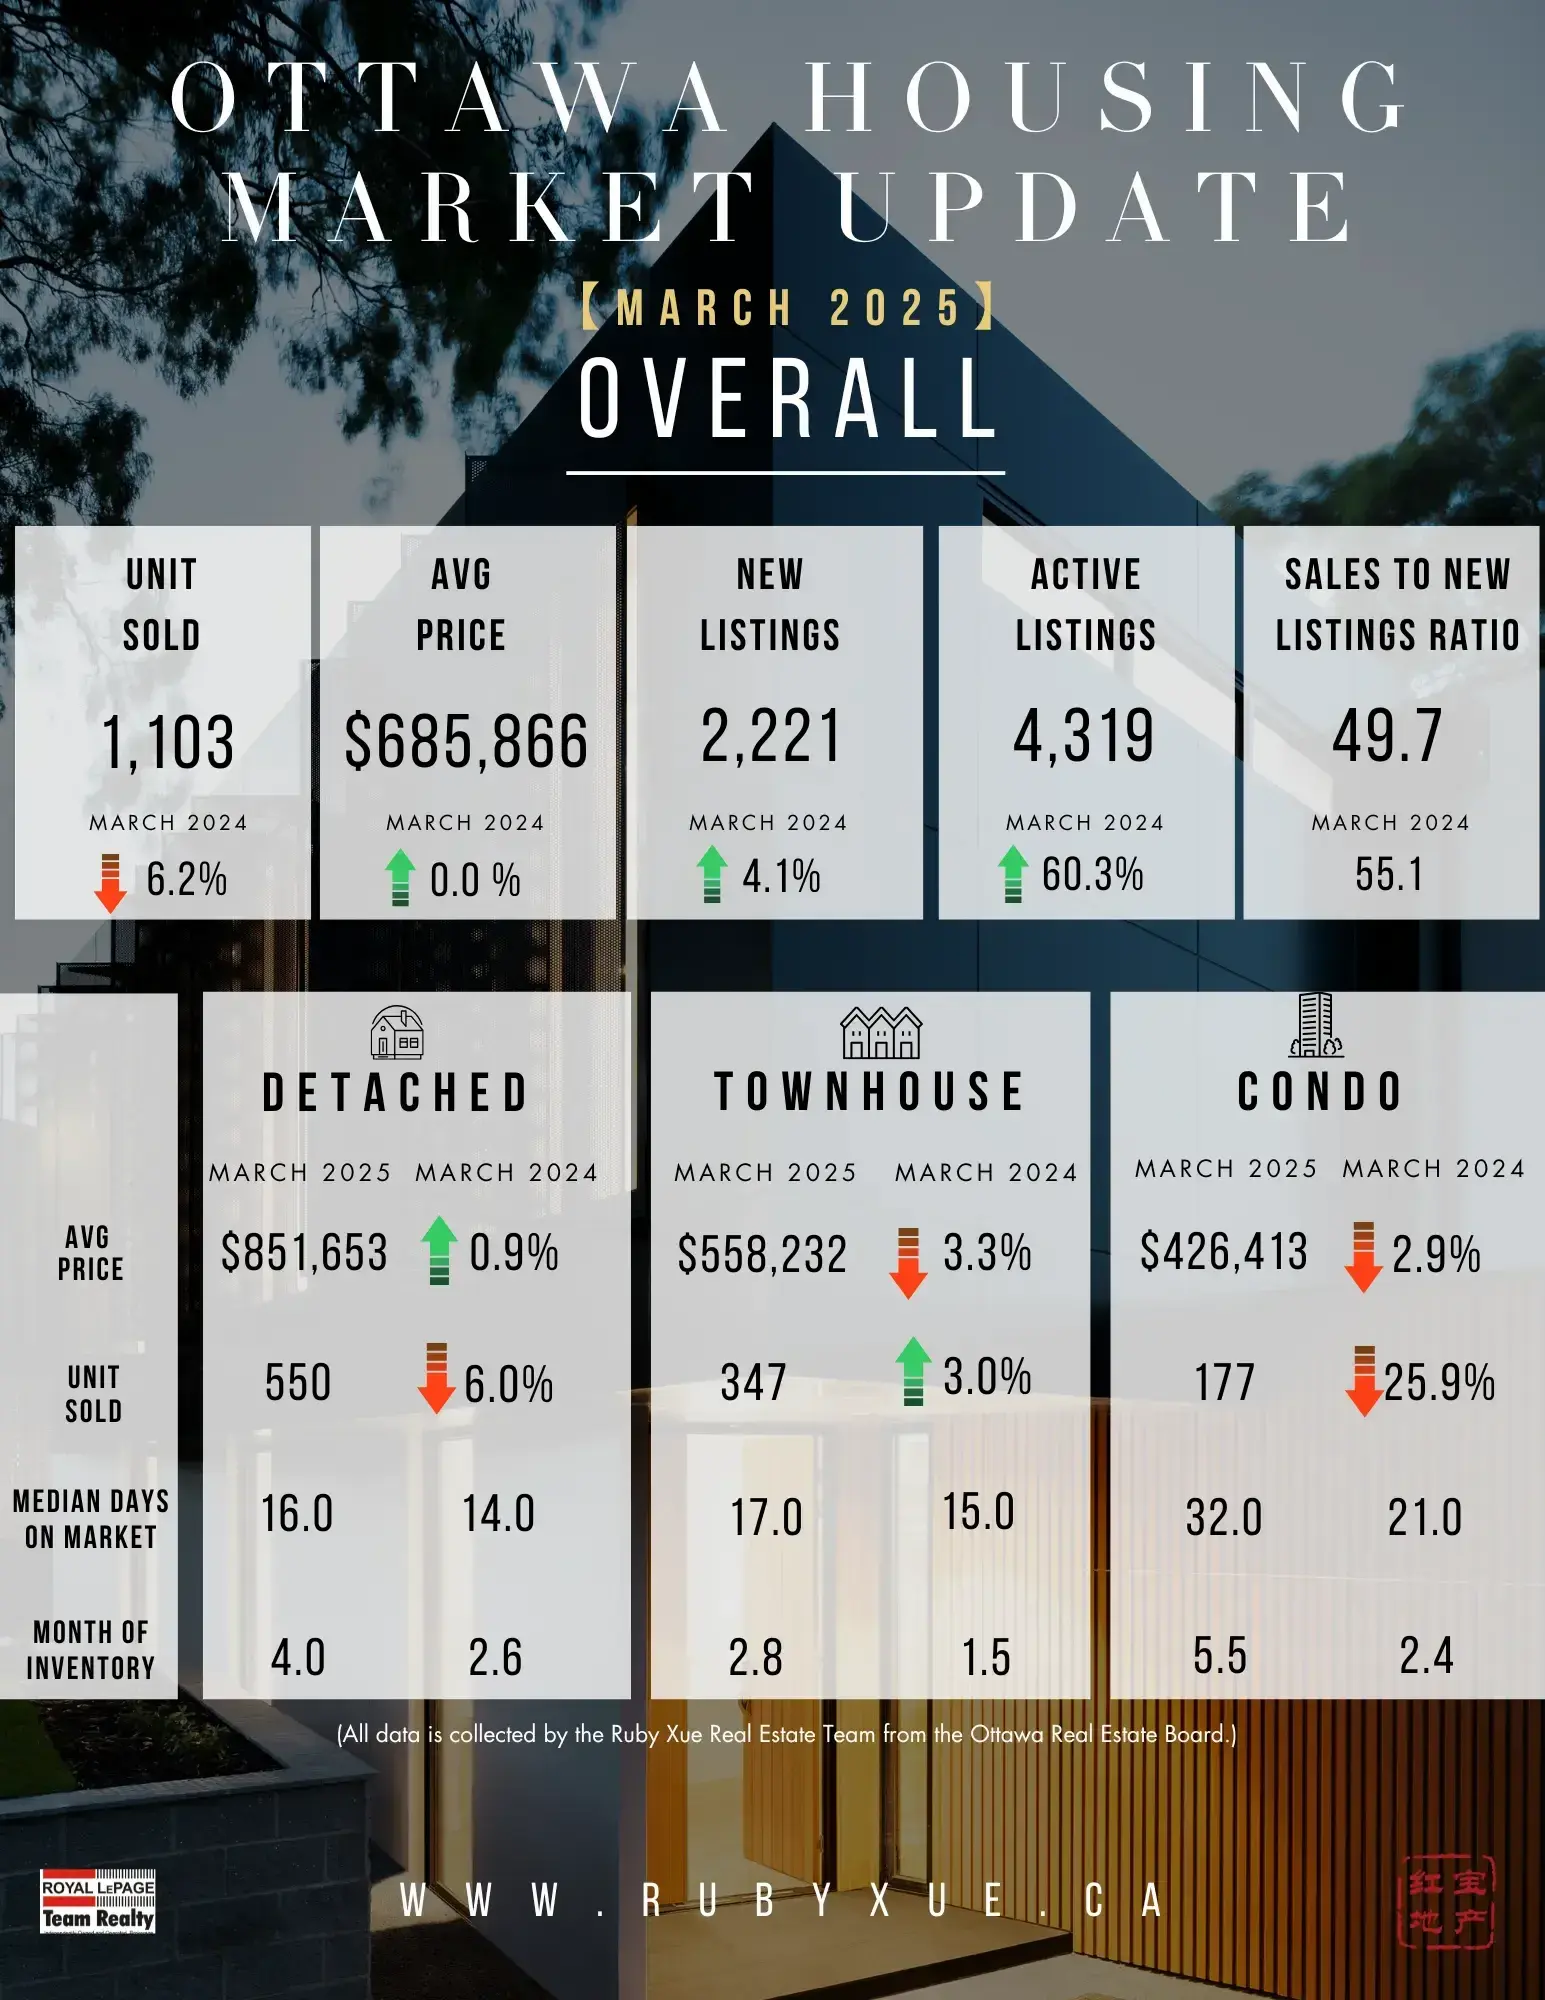
The number of homes sold through the MLS® System of the Ottawa Real Estate Board (OREB) totaled 1,103 units in March 2025. This represented a 6.2% decline from March 2024. 

Home sales were 24% below the five-year average and 19.3% below the 10-year average for the month of March.

“The Ottawa housing market in March 2025 remained relatively stable, with sales activity slightly lower than the same period last year,” said OREB President Paul Czan. “However, we’re seeing continued momentum month-over-month as the spring market gains traction. Both buyers and sellers are exercising some caution—likely due to economic uncertainty and the upcoming election—but the current lower interest rates are encouraging more activity as they step off the sidelines.”

“Looking ahead, the ongoing trade and tariff concerns could affect new construction and further exacerbate supply challenges,” Czan adds. “So, it’s critical that the City of Ottawa continues collaborating with key stakeholders. We were pleased to take part in discussions around the proposed New Zoning By-Law, which prioritizes housing options and opportunities to maximize options for Ottawa’s residents.”

By the Numbers – Prices:

  • The overall MLS® HPI composite benchmark price was $626,200 in March 2025, a 2.2% rise compared to March 2024.

    • The benchmark price for single-family homes was $698,700, up 2.7% year-over-year in March.

    • By comparison, the benchmark price for a townhouse/row unit was $431,200, a decline of 8.0% from 2024.

    • The benchmark apartment price was $400,900, a 4.3% decline from the previous year.

  • The average price of homes sold in March 2025 was $685,866, unchanged from March 2024.

  • The total dollar volume of all home sales in March 2025 amounted to $756.5 million, a 6.2% drop compared to the same period last year.

By the Numbers – Inventory & New Listings:

  • The number of new listings rose by 4.1% compared to March 2024, with 2,221 new residential properties added to the market. New listings were 0.7% below the five-year average and 2.2% below the 10-year average for the month of March.

  • Active residential listings totaled 4,319 units at the end of March 2025, reflecting a substantial 60.3% surge from March 2024. Active listings were 92.7% above the five-year average and 49.5% above the 10-year average for the month of March.

  • Months of inventory stood at 3.9 at the end of March 2025, compared to 2.3 in March 2024. The number of months of inventory is the number of months it would take to sell current inventories at the current rate of sales activity.

(SOURCE: OREB)

Read

渥太华市中心公寓的前世今生

相信在渥太华买过或投资过市中心公寓的朋友,一定有过这个感受,就是想赚钱太难了。我自己也投资过两个渥太华公寓,很早以前就果断出手了,结局也是和绝大多数人一样,是我多年来房产投资中唯一的两个不赚钱的房产。

那这究竟是什么原因呢,今天我来大致分析一下,渥太华的公寓市场不同于多伦多Montreal几个大城市,可以支付豪华公寓的金领一族并不多。这就导致了大多数的购买者都是投资客。租客大多数是大学生或单身白领。近几年由于以下几个原因,可以明显感觉到公寓市场的疲软了,

1.由于留学移民政策的改变,留学生变少了

2.海外买家税导致本来可以买公寓的外国学生也只能租房了

3.最近几年的贷款利率,大家都深有体会。投资的话不可能有现金流,自住的还不如租房划算

4.市中心几栋大型的出租物业的建成开放,这些因素导致了市中心的公寓,尤其是之前适合出租的几栋楼不管是售价还是租金都有损伤。

反观过去20年渥太华市中心的公寓市场,除去2021年的大涨,其实在2010到2012年涨过一波,原因是2008年市中心新建了几个大型的公寓项目,吸引了一波投资客和买家。在2012年之后市场逐渐饱和,导致价格从2012-2018价格年几乎持平。2018年之后有缓慢的上升,主要是因为海外资产的流入,那个时候留学生是很容易贷款的,即使来旅游的游客也可以买一套投资房。再来大涨是在2019年-2022年,主要原因大家都知道是因为利率的大幅下降了,由于这波利率的红利,3年间大约涨了50%以上。如果是在2022年初把公寓卖掉的那波人,可能对这个还是比较满意的。 但除了这波人,即使是早年的投资者,如果没有坚持这个时候,也都有公寓并不赚钱的感受。

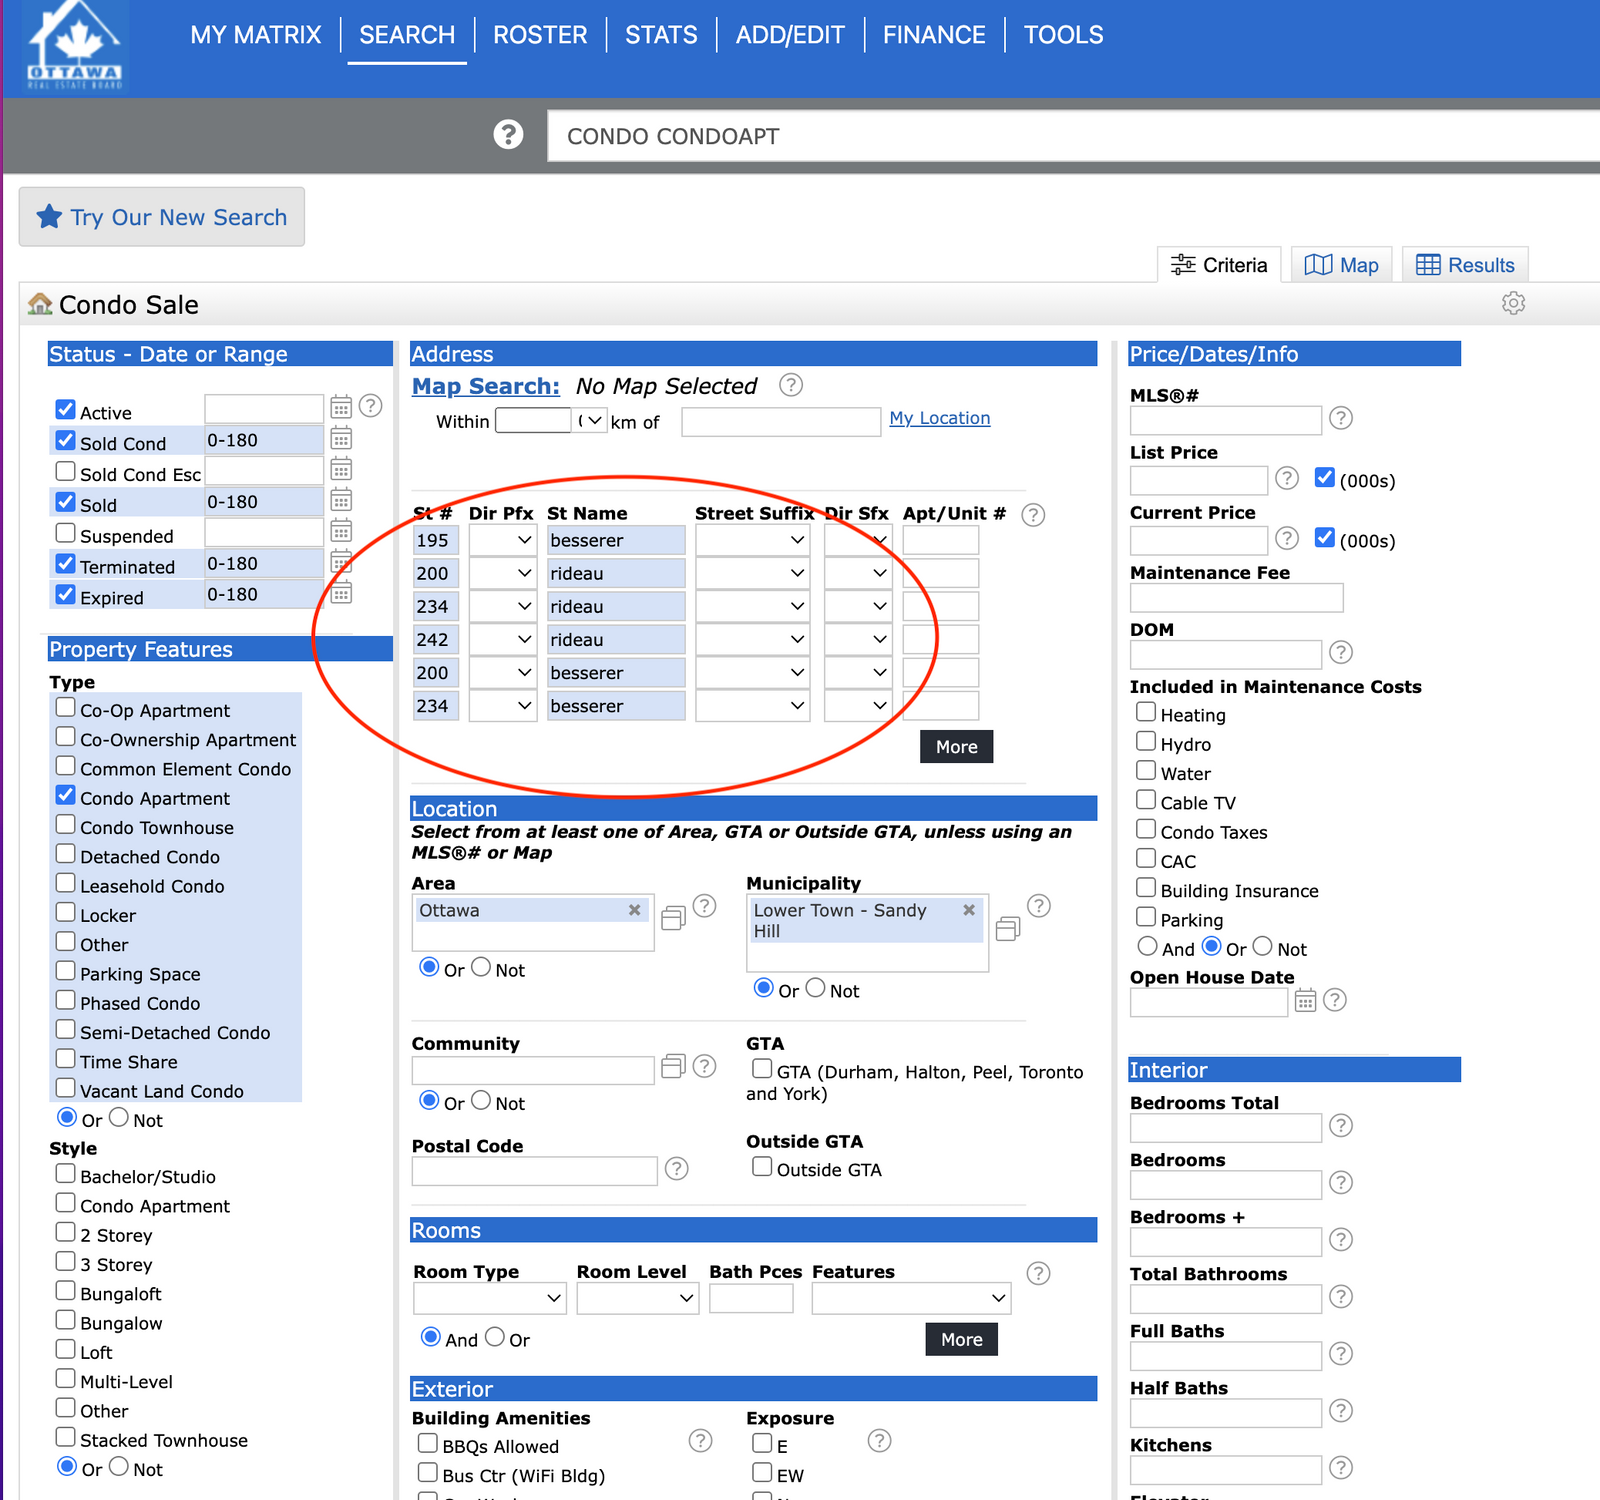
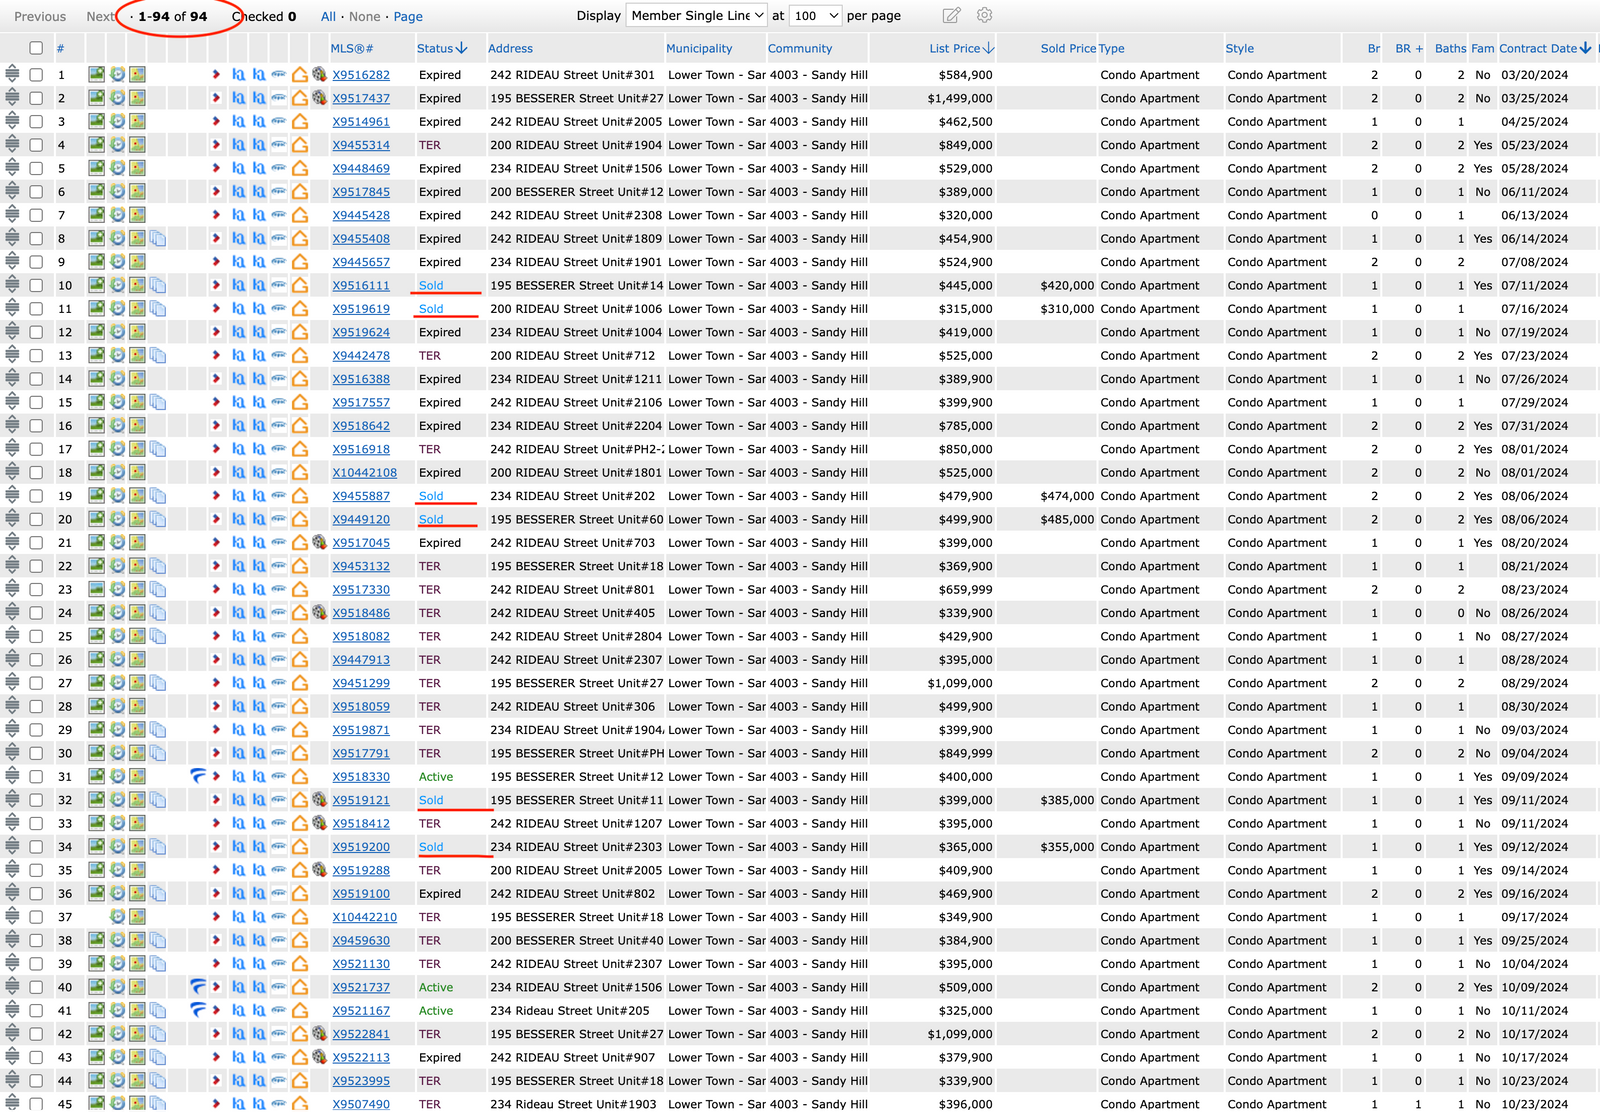
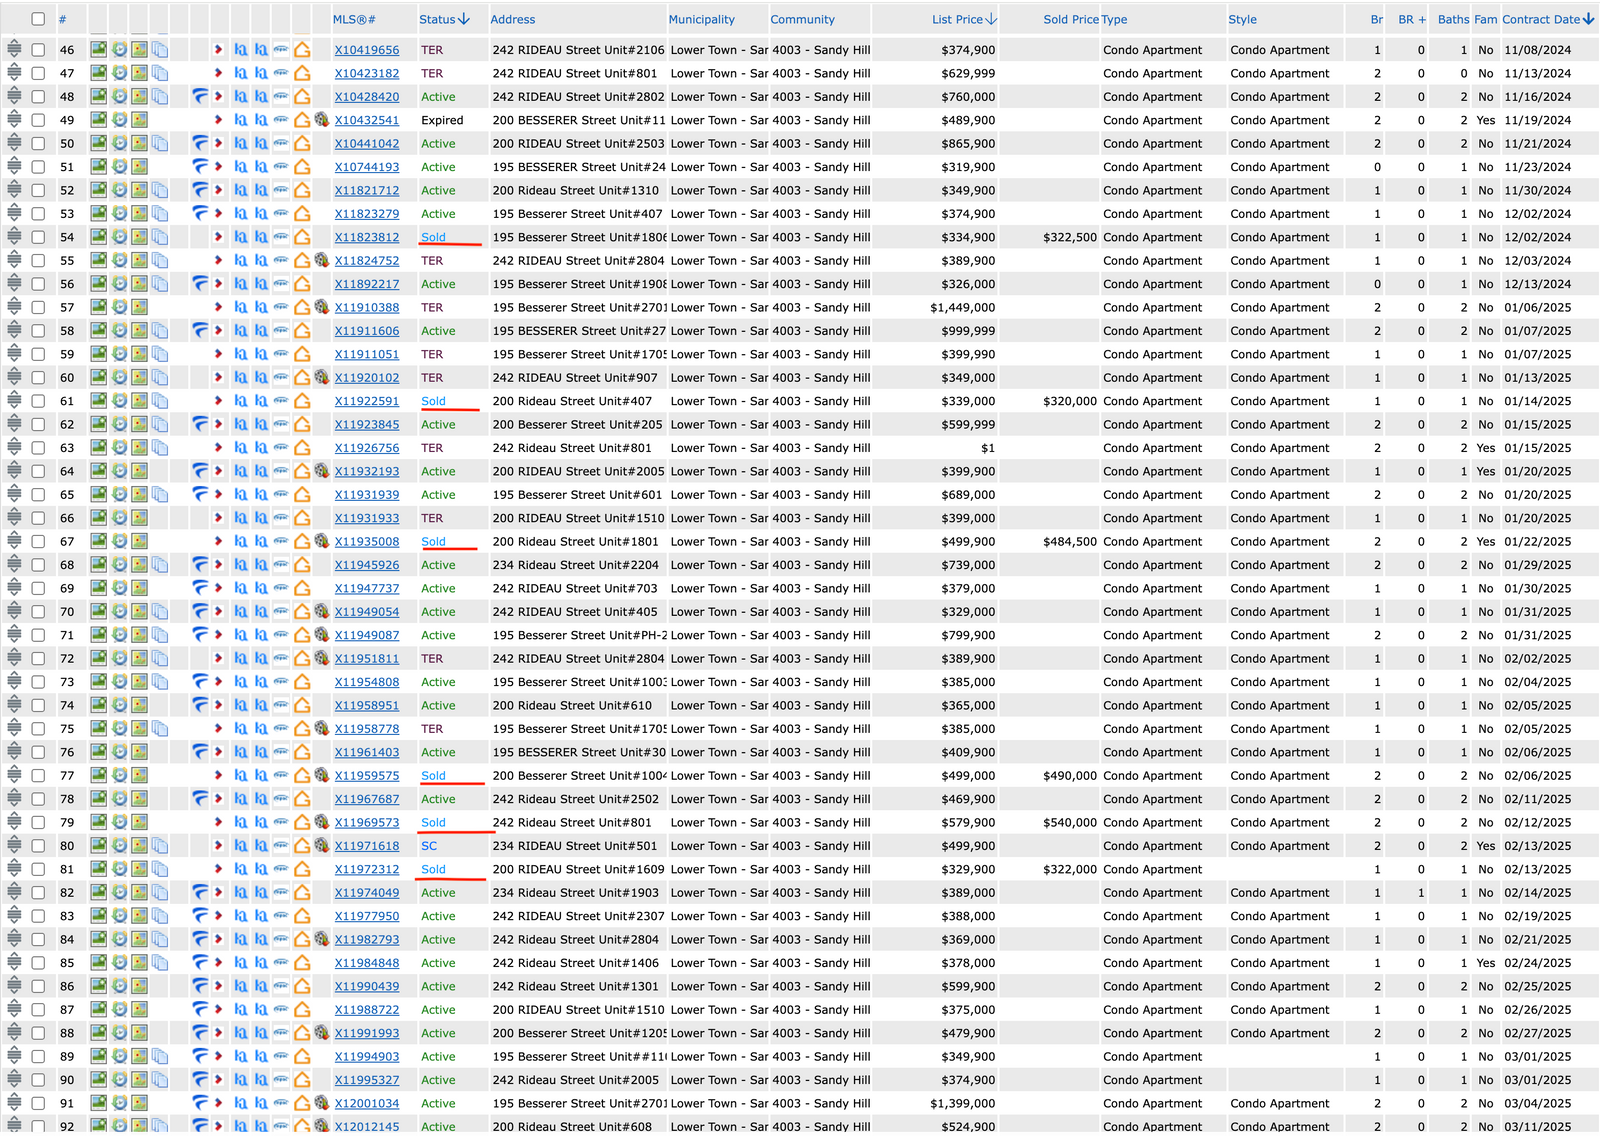
拿渥太华大学旁边几栋受欢迎的楼盘为例,最高点的时候一套195Besserer的一室户型卖过50万以上,而目前同户型最高的价格也就是42万左右。目前渥太华大学附近几栋投资客比较多的楼盘,在最近的180天中,一共有94套在市,过期和撤盘,而售出只有仅仅12套。 这其中有3套售出是我们团队的挂盘。

下面我大致的给想出手公寓的客人几点建议,有具体需要的可以私下联系我。首先挂盘价格一定要切实际,要精准的根据户型来判断挂盘价,一定不要挂个虚高价等买家来砍,因为这么大的挂盘量,如果价格挂高很可能就被淹没了,会导致长时间的挂盘之后价格就会变软。最后不得不降价。最后房主拿到手的价格还不如一开始就响亮地和买家谈判。

二是在众多的挂盘中,一定要脱颖而出。公寓一般不需要大装修,但整体的感觉一定是要过关的。那些不算整洁的样貌和不够赏心悦目的形象,都可能导致没人来看。现在的市场看房的人并不多,但只要是能来看的,都基本上是准备入手的。所以一定要抓住少有的来看房的眼球。

总结:价格首先吸引人来看,状态吸引人来下单。

#渥太华房产 #加拿大房产投资 #公寓投资 #房产市场趋势 #渥太华生活 #渥太华地产经纪 #买房卖房 #渥太华房价

(本文由渥太华红宝地产团队原创,如需转载请标明出处)

更多渥太华房市最新动向,房价解析,地产资讯,请戳下方:

最新!渥太华房市近五年大比拼|2025房价走势预测

怎样迅速卖掉带租客的物业? | 2025渥太华房市

【 渥太华买房哪个区好】细数渥太华的豪宅社区TOP 6

【渥太华买房】渥太华有多少华人? 渥太华华人最喜爱的社区

【 渥太华买房哪个区好】一篇文章带您走遍渥太华-渥太华市中心区域篇

【渥太华买房哪个区好】一篇文章带你走遍渥太华-老城区篇

【渥太华买房哪个区好】一篇文章带你走遍渥太华-中城区篇

【渥太华买房哪个区好】一篇文章带你走遍渥太华-卫星城篇

【 渥太华买房哪个区好】一篇文章带您走遍渥太华-渥太华郊区大地豪宅篇

【渥太华学区房】小学篇

Read

渥太华房价【红宝地产】2025.2月房市数据报告

渥太华房地产市场在变化中保持稳定

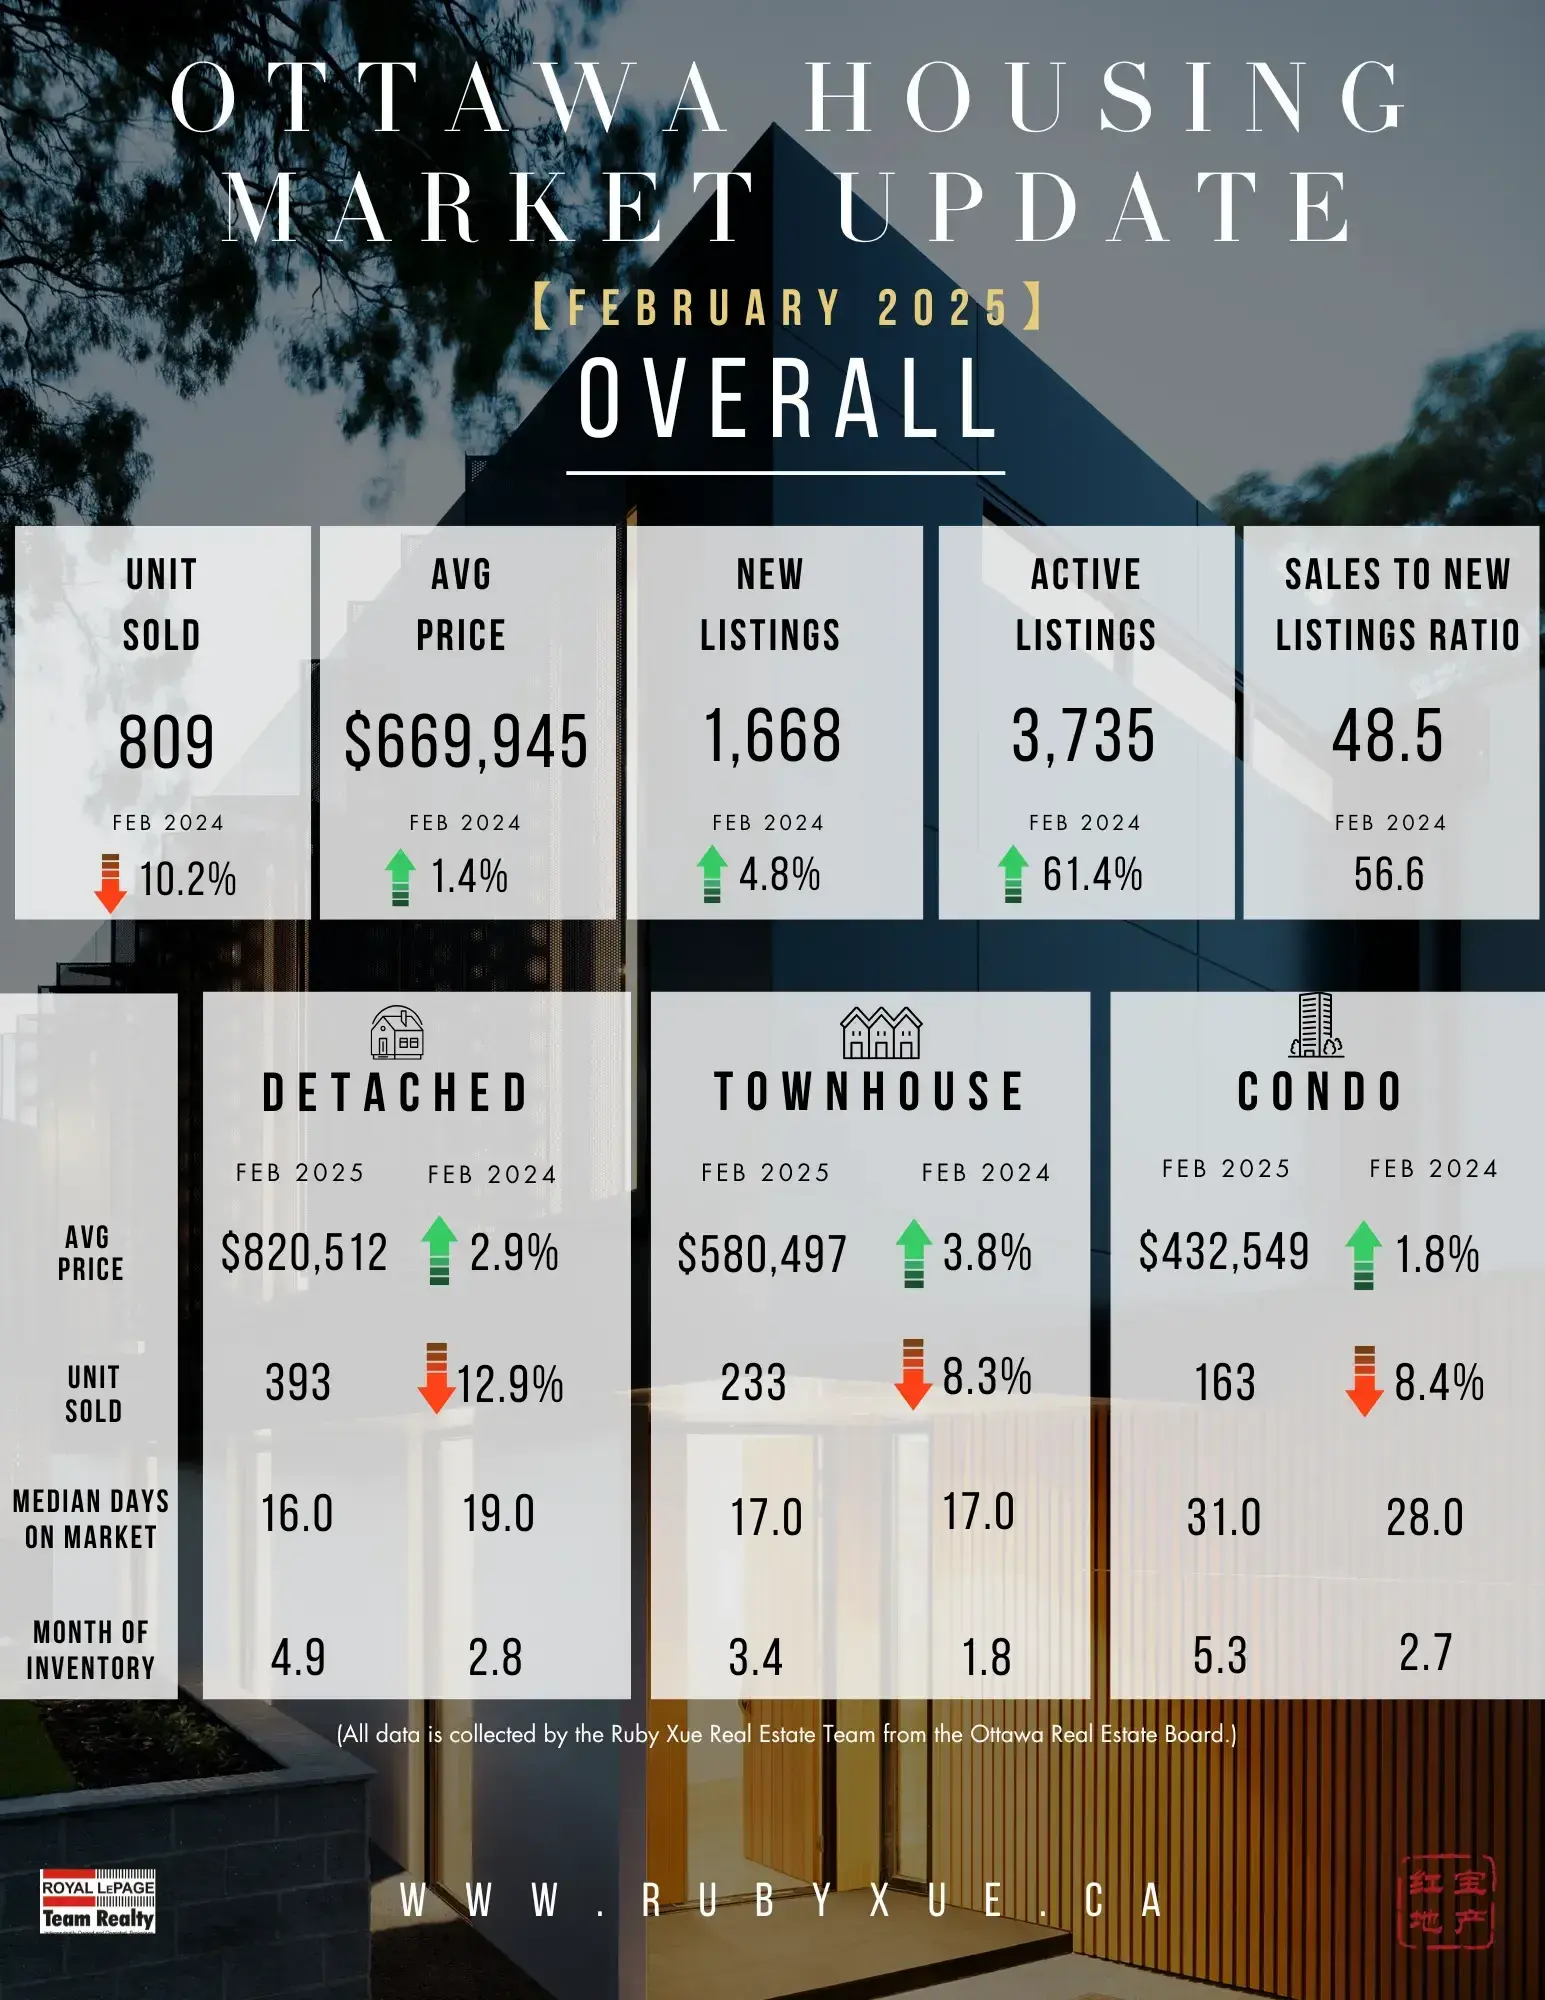
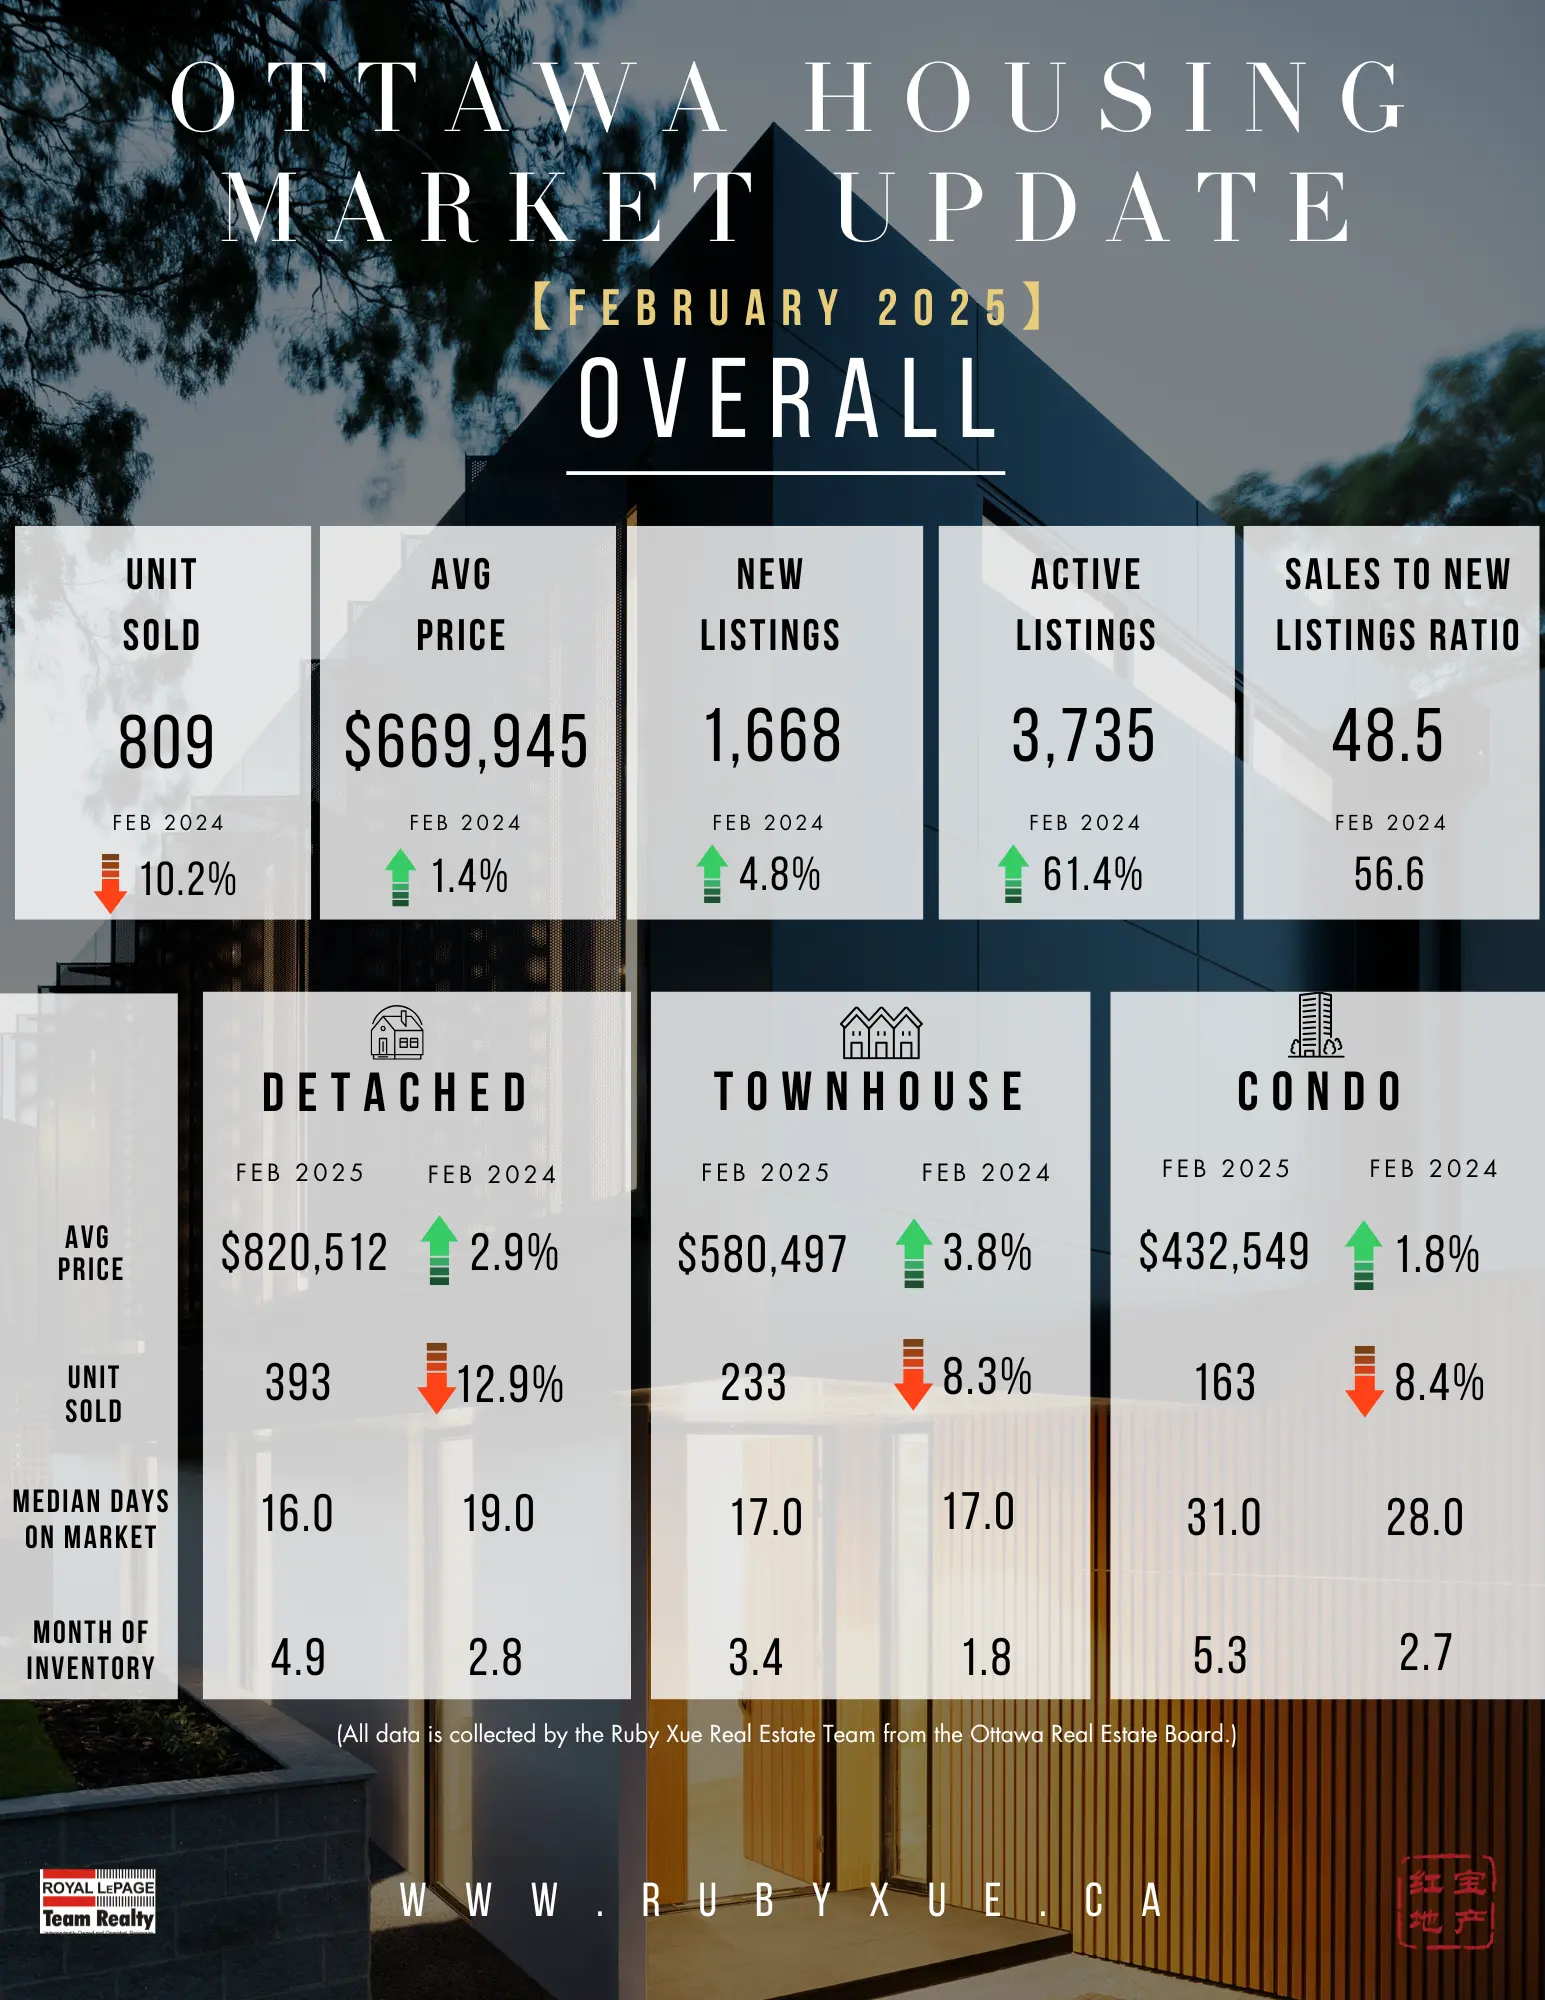
根据渥太华房地产委员会的数据,2025年2月通过MLS®系统售出的房屋总数为809套,比2024年2月下降了 10.2%

2月份的房屋销售量比五年平均水平低19.1%,比十年平均水平低15.4%

“尽管库存增加,但市场不确定性仍在影响买卖双方的决策,因此渥太华的销售活动有所放缓,但房价保持稳定。” OREB主席Paul Czan表示,“一些原本计划推迟上市的卖家现在已经进入市场,为买家提供了更多选择。尽管部分价格区间的需求依然强劲,但整体销售节奏放缓,这也意味着定价策略和房源准备工作对卖家而言变得尤为重要。”

Czan补充道:“加拿大央行(Bank of Canada)的利率政策、持续的经济因素(如关税)以及即将到来的选举对买卖双方的市场情绪也产生了一定影响。随着春季市场的到来,如果利率出现下行、市场信心持续增强,我们预计买家活跃度将会增加。”

📊 数据概览 — 房价

MLS® 房价指数(Home Price Index,HPI)能更准确地反映房价趋势,而不是仅仅通过平均价格或中位数价格来判断。

  • 整体HPI综合基准价格:2025年2月渥太华的综合基准价格为658,300加元,比2024年2月上涨4.4%

  • 独立屋基准价格:2025年2月独立屋的基准价格为719,800加元,同比增长1.3%

  • 联排别墅/排屋基准价格:2025年2月联排别墅的基准价格为438,000加元,同比下降11.6%

  • 公寓基准价格:2025年2月公寓的基准价格为459,300加元,同比增长4.5%

  • 房屋销售均价:2025年2月房屋的平均售价669,945加元,比2024年2月增长1.4%

  • 总销售额:2025年2月的房屋总销售额达5.419亿加元,比去年同期下降8.9%

OREB特别提醒:平均房价仅能反映市场的总体趋势,并不代表某个具体房产的价值变化。因为平均售价是基于所有成交房产的总销售额计算的,因此不同社区之间的价格会有所不同。

🏡 数据概览 — 库存和新增房源

  • 新增房源:2025年2月新增的住宅挂牌数量为1,668套,比2024年2月增加4.8%。2月份的新增房源数量比五年平均水平高10.8%,比十年平均水平高6.7%

  • 市场库存量:截至2025年2月底,活跃住宅挂牌总数为3,735套,同比增长61.4%。这一数字比五年平均水平高95.7%,比十年平均水平高51.4%

  • 库存消化周期:截至2025年2月底,市场的库存消化周期为4.6个月,而2024年2月仅为2.6个月。库存消化周期指的是在当前的销售速度下,市场上所有房源售罄所需的时间

总结:
目前渥太华的房地产市场正在经历库存量增加、销售速度放缓但价格保持稳定的情况。随着更多卖家将房源推向市场,以及春季市场的到来,如果利率下降市场信心回升,预计买家活动将逐步增加。对于卖家而言,合理的定价和良好的房屋准备将是确保成功售出的关键。

(数据来源:渥太华地产局OREB)

Read

OTTAWA REAL ESTATE - FEBRUARY STATS (2025)

Ottawa Real Estate Market Holds Steady Amid Changing Conditions

The number of homes sold through the MLS® System of the Ottawa Real Estate Board (OREB) totaled 809 units in February 2025. This represented a 10.2% decline from February 2024.

Home sales were 19.1% below the five-year average and 15.4% below the 10-year average for the month of February.

“Ottawa’s sales activity moderated while prices held steady,” says OREB President Paul Czan. “Despite increased inventory, market uncertainty continues to influence buyer and seller decisions. Some sellers who had previously delayed listing are now entering the market, contributing to more options for buyers. While demand remains strong in certain price segments, the pace of sales varies, making strategic pricing and preparation key for sellers.”

“The Bank of Canada’s influence on borrowing power, ongoing economic factors like tariffs, and the potential impact of upcoming elections are also shaping buyer and seller sentiment,” adds Czan. “As we approach the spring market, we anticipate increased buyer activity, particularly if interest rates trend downward and confidence continues to build.”

By the Numbers – Prices:

The MLS® Home Price Index (HPI) tracks price trends far more accurately than is possible using average or median price measures.

  • The overall MLS® HPI composite benchmark price was $658,300 in February 2025, a 4.4% rise compared to February 2024.

    • The benchmark price for single-family homes was $719,800, up 1.3% year-over-year uptick in February.

    • By comparison, the benchmark price for a townhouse/row unit was $438,000, a decline of 11.6% from 2024.  

    • The benchmark apartment price was $459,300, a 4.5% gain from the previous year. 

  • The average price of homes sold in February 2025 was $669,945, a 1.4% improvement from February 2024. 

  • The total dollar volume of all home sales in February 2025 amounted to $541.9 million, an 8.9% drop compared to the same period last year.

OREB cautions that the average sale price can be useful in establishing trends over time but should not be used as an indicator that specific properties have increased or decreased in value. The calculation of the average sale price is based on the total dollar volume of all properties sold. Prices will vary from neighbourhood to neighbourhood.

By the Numbers – Inventory & New Listings:

  • The number of new listings rose by 4.8% compared to February 2024, with 1,668 new residential properties added to the market. New listings were 10.8% above the five-year average and 6.7% above the 10-year average for the month of February.

  • Active residential listings totaled 3,735 units at the end of February 2025, reflecting a substantial 61.4% surge from February 2024. Active listings were 95.7% above the five-year average and 51.4% above the 10-year average for the month of February.

  • Months of inventory stood at 4.6 at the end of February 2025, compared to 2.6 in February 2024. The number of months of inventory is the number of months it would take to sell current inventories at the current rate of sales activity.

(SOURCE: OREB)

Read

OTTAWA REAL ESTATE - JANUARY STATS (2025)

Ottawa’s Market Warms Up with More Listings and Cautious Buyers

The number of homes sold through the MLS® System of the Ottawa Real Estate Board (OREB) totaled 617 units in January 2025. This was a 4.2% decrease from January 2024.    

Home sales were 13% below the five-year average and 9.6% below the 10-year average for the month of January. 

“Ottawa’s market is seeing increased activity as more listings hit the market and buyers start to re-engage,” says OREB President Paul Czan. “Many buyers and sellers had been waiting for more conducive market conditions, but with the recent rate cut and potentially lower interest rates on the horizon, optimism is growing. While there’s more supply, the availability of suitable properties in various market segments remains tight. This is reflected in some homes selling quickly while others linger on the market. Sellers should be prepared to price competitively and present their homes in the best light to capture buyer interest in this evolving market.”

“The recent Bank of Canada rate cut, introduction of U.S. tariffs, along with upcoming provincial and federal elections, introduce factors of variability,” adds Czan. “That said, confidence is growing, and more buyers are expected to return to the market in the coming months, leading to an increase in transactions.”

By the Numbers – Prices: 

The MLS® Home Price Index (HPI) tracks price trends far more accurately than is possible using average or median price measures. 

  • The overall MLS® HPI composite benchmark price was $649,900 in January 2025, an increase of 5.2% from January 2024.  

    • The benchmark price for single-family homes was $713,000 up 2.3% on a year-over-year basis in January.  

    • By comparison, the benchmark price for a townhouse/row unit was $448,000, down 3.9% compared to a year earlier.  

    • The benchmark apartment price was $436,900, up 4.5% from last year. 

  • The average price of homes sold in January 2025 was $670,258, increasing 5.8% from January 2024.  

  • The dollar volume of all home sales in January 2025 was $413.5 million, up 1.3% from January 2024.  

OREB cautions that the average sale price can be useful in establishing trends over time but should not be used as an indicator that specific properties have increased or decreased in value. The calculation of the average sale price is based on the total dollar volume of all properties sold. Prices will vary from neighbourhood to neighbourhood.  

By the Numbers – Inventory & New Listings 

  • The number of new listings saw an increase of 3.0% from January 2024. There were 1,359 new residential listings in January 2025. New listings were 14.1% above the five-year average and 9.3% above the 10-year average for the month of January. 

  • Active residential listings numbered 3,312 units on the market at the end of January 2025, a gain of 57.3% from January 2024. Active listings were 90.6% above the five-year average and 48.9% above the 10-year average for the month of January. 

  • Months of inventory numbered 5.4 at the end of January 2025, compared to 3.3 in January 2024. The number of months of inventory is the number of months it would take to sell current inventories at the current rate of sales activity. 

(SOURCE: OREB)

Read

渥太华房价【红宝地产】2025.1月房市数据报告

渥太华房市升温:房源增加,买家谨慎入市

根据渥太华房地产委员会(OREB)MLS®系统的统计,2025年1月渥太华共售出617套房产,比2024年1月下降4.2%

房屋销售量比五年平均水平低13%,比十年平均水平低9.6%

OREB主席 Paul Czan 表示:“随着市场上新房源的增加,买家开始重返市场,渥太华的房地产市场正在回暖。许多买家和卖家此前一直在等待更有利的市场条件,而最近的利率下调以及未来可能进一步降低的利率,正在提升市场的乐观情绪。

虽然房源供应有所增加,但各个细分市场仍存在房源紧缺的情况。这种现象反映在部分房屋快速售出,而另一些房屋则在市场上停留更久。卖家需要做好竞争性定价,并尽可能优化房屋展示,以吸引买家兴趣。

Czan补充道:“加拿大央行近期的降息美国新关税政策,以及即将到来的省级和联邦选举,都为市场带来一定的不确定性。尽管如此,市场信心正在恢复,预计未来几个月会有更多买家重返市场,推动交易量增长。”

市场数据 – 房价趋势

MLS®房价指数(HPI)比传统的均价或中位数价格更准确地反映市场价格趋势。

  • 2025年1月,MLS® HPI 综合基准房价为 $649,900,同比增长 5.2%。

  • 独立屋基准价格为 $713,000,较去年同期上涨 2.3%。

  • 联排别墅/排屋基准价格为 $448,000,同比下降 3.9%。

  • 公寓基准价格为 $436,900,同比增长 4.5%。

  • 2025年1月房屋销售均价为 $670,258,较 2024 年 1 月上涨 5.8%。

  • 1月所有房产的总销售额为 $4.135 亿,比 2024 年 1 月增长 1.3%。

OREB 提醒,均价可用于长期趋势分析,但不能直接反映具体房产的升值或贬值,房价的计算基于所有已售房产的总销售金额,不同社区的价格走势可能存在差异。

市场数据 – 房源与库存

  • 新上市房源: 2025年1月新增1,359套住宅房源,较2024年1月增长3.0%。新房源数量比五年平均水平高 14.1%,比十年平均水平高 9.3%

  • 市场上的活跃房源: 截至2025年1月底,共有3,312套活跃住宅房源,较2024年1月增长 57.3%,比五年平均水平高 90.6%,比十年平均水平高 48.9%

  • 库存周期(月库存量): 2025年1月底,市场库存周期为5.4个月,相比2024年1月的3.3个月有所增加。库存周期表示按当前的销售速度,市场上的房源需要多久才能售完。

总结: 渥太华市场正在回暖,新房源数量持续增长,买家则保持谨慎态度。随着利率下调带来的市场信心回升,未来几个月有望迎来更多买家入市,推动市场交易量增长。🏡📈

(数据来源:渥太华地产局OREB)

Read
This website may only be used by consumers that have a bona fide interest in the purchase, sale, or lease of real estate of the type being offered via the website. The data relating to real estate on this website comes in part from the MLS® Reciprocity program of the PropTx MLS®. The data is deemed reliable but is not guaranteed to be accurate.