Posted on
August 8, 2024
by
Ruby Xue薛如冰
Ottawa’s MLS® Market Gains Momentum Heading into Summer
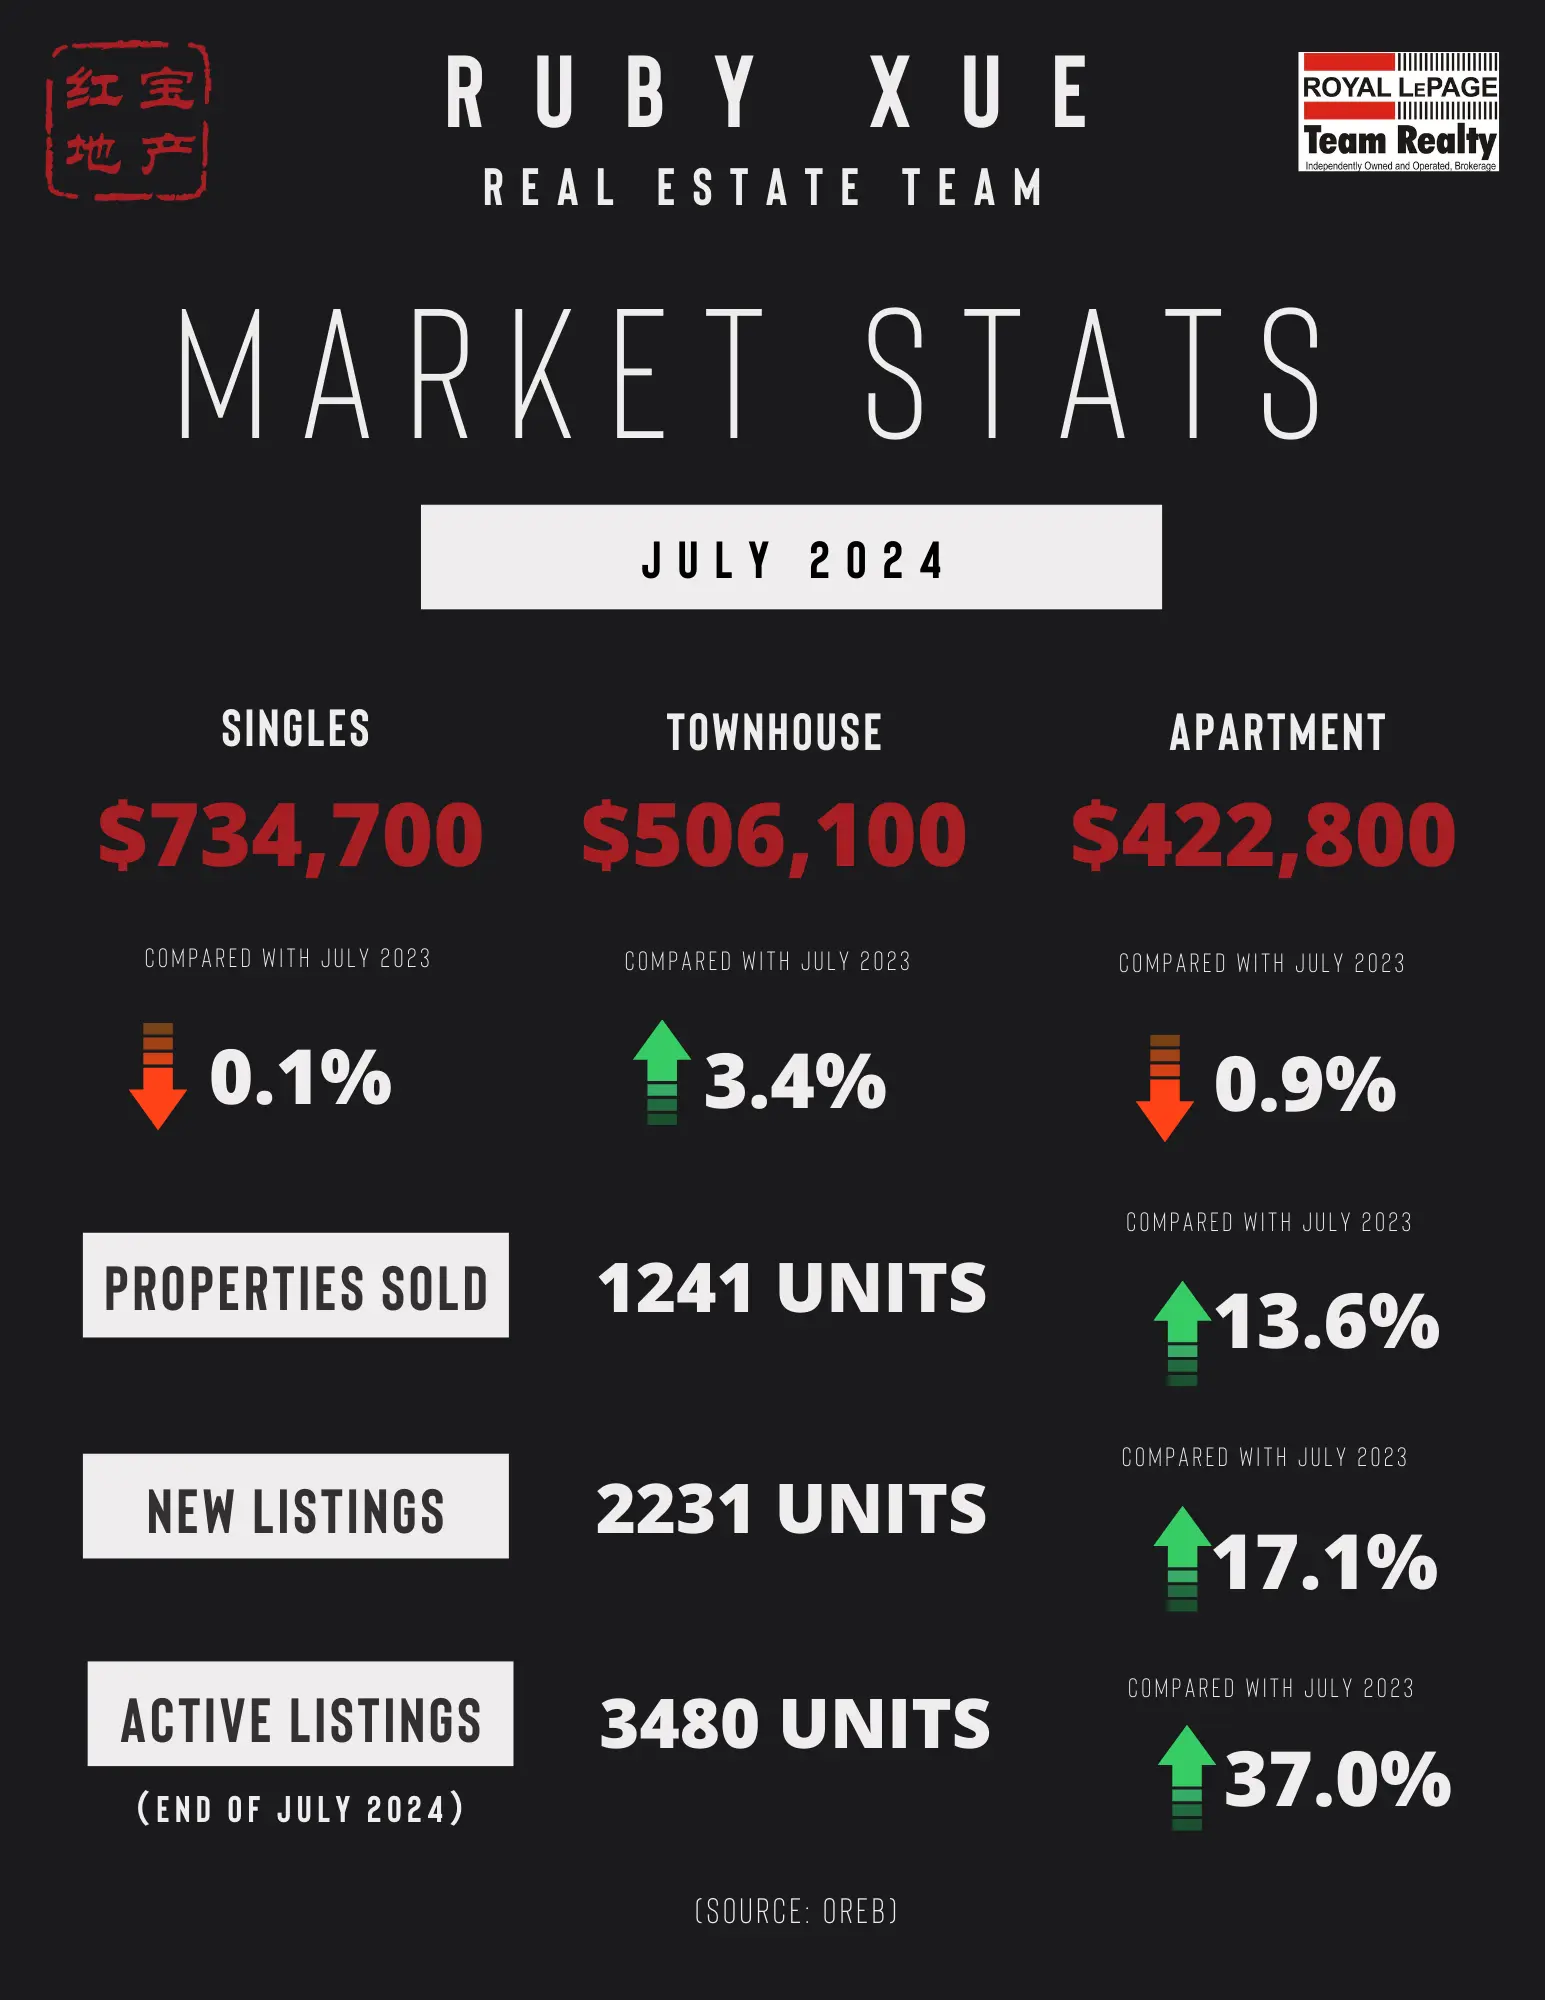
The number of homes sold through the MLS® System of the Ottawa Real Estate Board (OREB) totaled 1,241 units in July 2024. This was a 13.6% increase from July 2023.
Home sales were 7.1% below the five-year average and 8.8% below the 10-year average for the month of July.
On a year-to-date basis, home sales totaled 8,349 units in July 2024 — an increase of 5.5% from the same period in 2023.
“As the market pace typically slows in the summer, July’s activity is encouraging and could be a sign of more gains ahead,” says OREB President Curtis Fillier. “Buyer confidence is slowly but surely catching up while sellers continue to add a steady stream of new listings. Of course, the extent to which that translates into transactions depends on the type of properties and price points available in our communities as supply and affordability issues persist.”
“It’s too early to tell, but recent policy developments could be a boost,” says Fillier. “Two consecutive interest rate cuts by the Bank of Canada, coupled with the federal government’s introduction of 30-year amortization periods on mortgages for first-time homebuyers purchasing newly built homes, will help some buyers. However, these are demand policies and Ottawa — as well as many cities across the country — needs action on the supply side.”
In its Monetary Policy Report, the Bank of Canada points to municipal zoning restrictions and high development fees as long-standing standing challenges to supply growth. Recent data from the Ontario government shows Ottawa is significantly behind its housing starts goal having only built 1,593 homes out of its 12,583 target for 2024. OREB and its member REALTORS® continue to advocate for direct solutions to address the city’s housing crisis, such as allowing four units per lot and reducing costly development fees.
By the Numbers – Prices:
The MLS® Home Price Index (HPI) tracks price trends far more accurately than is possible using average or median price measures.
The overall MLS® HPI composite benchmark price was $648,900 in July 2024, an increase of 0.1% from July 2023.
The benchmark price for single-family homes was $734,700, down 0.1% on a year-over-year basis in July.
By comparison, the benchmark price for a townhouse/row unit was $506,100, up 3.4% compared to a year earlier.
The benchmark apartment price was $422,800, down 0.9% from year-ago levels.
The average price of homes sold in July 2024 was $679,610 decreasing 2.1% from July 2023. The more comprehensive year-to-date average price was $681,082, increasing by 1.0% from July 2023.
The dollar volume of all home sales in July 2024 was $843.3 million, up 11.3% from July 2023.
OREB cautions that the average sale price can be useful in establishing trends over time but should not be used as an indicator that specific properties have increased or decreased in value. The calculation of the average sale price is based on the total dollar volume of all properties sold. Prices will vary from neighbourhood to neighbourhood.
By the Numbers – Inventory & New Listings
The number of new listings saw an increase of 17.1% from July 2023. There were 2,231 new residential listings in July 2024. New listings were % below the five-year average and % below the 10-year average for the month of July.
Active residential listings numbered 3,480 units on the market at the end of July 2024, a gain of 37.0% from July 2023. Active listings were % above the five-year average and % below the 10-year average for the month of July.
Months of inventory numbered 2.8 at the end of July 2024, up from 2.3 in July 2023. The number of months of inventory is the number of months it would take to sell current inventories at the current rate of sales activity.
(SOURCE: OREB)