RSS

OTTAWA REAL ESTATE - MAY STATS (2024)

May MLS® Home Sales in Ottawa Smooth and Cautious

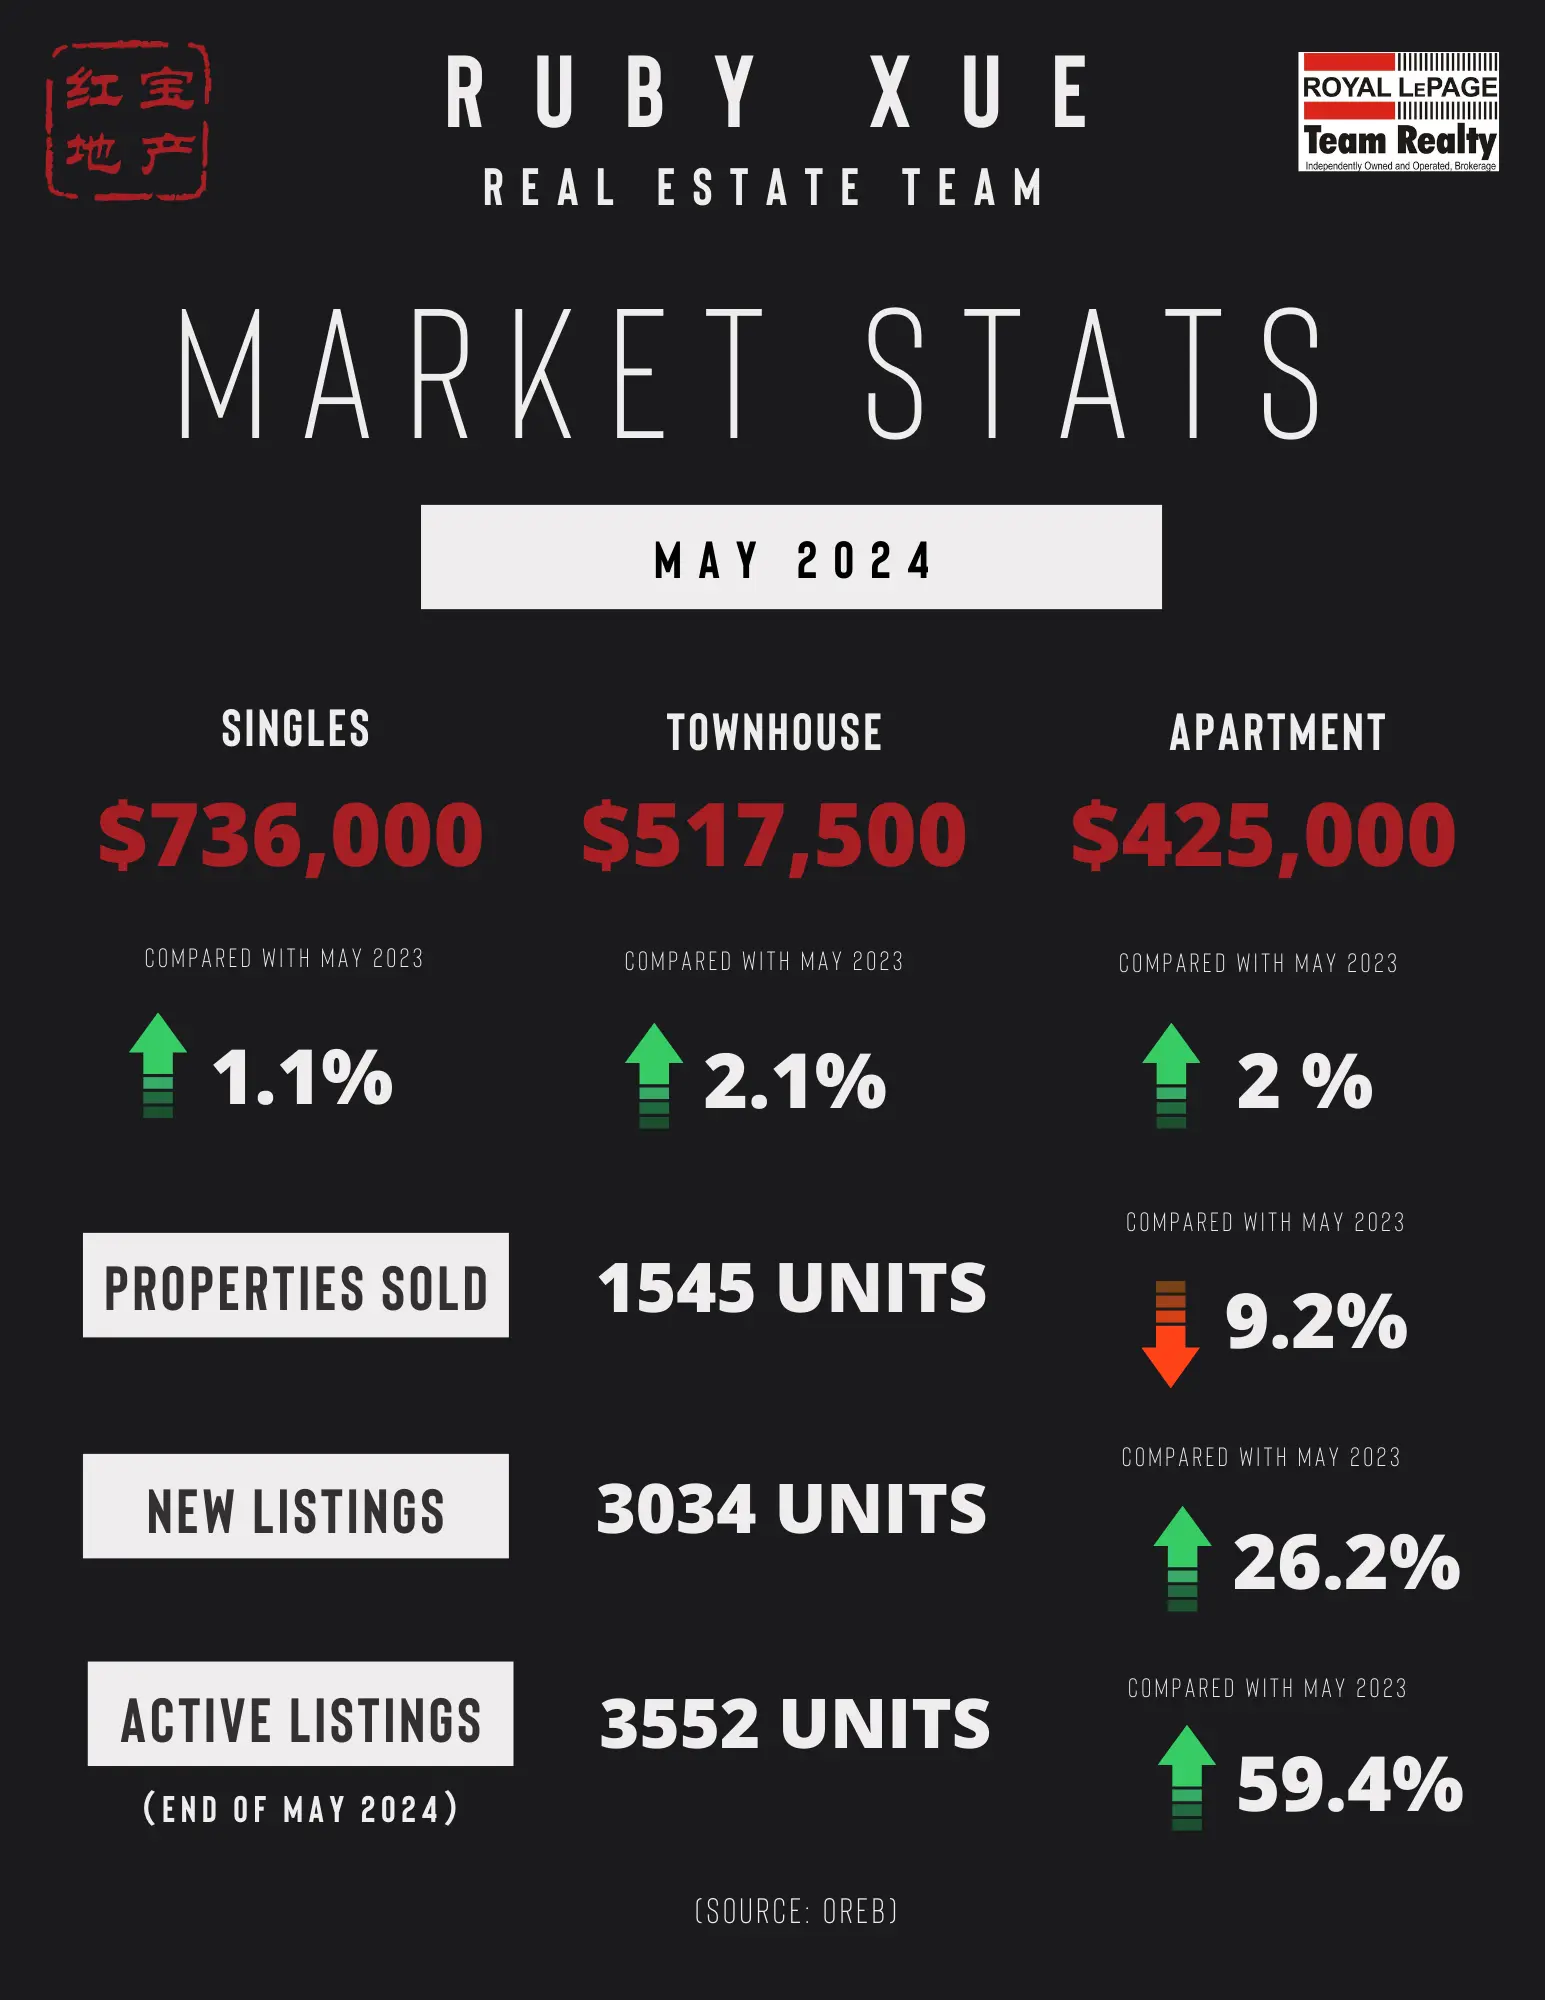
The number of homes sold through the MLS® System of the Ottawa Real Estate Board (OREB) totaled 1,545 units in May 2024. This was a decrease of 9.2% from May 2023.

Home sales were 3.7% below the five-year average and 13.2% below the 10-year average for the month of May.

On a year-to-date basis, home sales totaled 5,673 units over the first five months of the year — an increase of 5.2% from the same period in 2023.

“Ottawa’s early spring market was unsurprisingly steady,” says OREB President Curtis Fillier. “The increase in new listings indicate that sellers are more confident that properties are moving as more activity returns to the market. Some sellers, however, were likely waiting for the Bank of Canada’s interest rate announcement to see if it would affect their purchasing power. The first interest rate cut in four years is good news, but expectations still need to be managed as long as supply issues and high home prices persist.”

“Interest rate cuts, for example, can’t help get more homes built and make them affordable when the City of Ottawa is hiking development fees — a counterproductive move that OREB is firmly against.”

By the Numbers – Prices:

The MLS® Home Price Index (HPI) tracks price trends far more accurately than is possible using average or median price measures.

  • The overall MLS® HPI composite benchmark price was $651,300 in May 2024, a marginal gain of 1.2% from May 2023.

    • The benchmark price for single-family homes was $736,000, up 1.1% on a year-over-year basis in May.

    • By comparison, the benchmark price for a townhouse/row unit was $517,500, up 2.1% compared to a year earlier.

    • The benchmark apartment price was $425,000, up 2.0% from year-ago levels.

    • The average price of homes sold in May 2024 was $690,683 increasing 0.8% from May 2023. The more comprehensive year-to-date average price was $679,862, increasing by 1.8% from the first five months of 2023.

  • The dollar volume of all home sales in May 2024 was $1.06 billion, down 8.5% from the same month in 2023.

OREB cautions that the average sale price can be useful in establishing trends over time but should not be used as an indicator that specific properties have increased or decreased in value. The calculation of the average sale price is based on the total dollar volume of all properties sold. Prices will vary from neighbourhood to neighbourhood.

By the Numbers – Inventory & New Listings

  • The number of new listings saw an increase of 26.2% from May 2023. There were 3,034 new residential listings in May 2024. New listings were 23.2% above the five-year average and 10.2% above the 10-year average for the month of May.

  • Active residential listings numbered 3,552 units on the market at the end of May 2024, a gain of 59.4% from May 2023. Active listings were 72.2% above the five-year average and 2.9% below the 10-year average for the month of May.

  • Months of inventory numbered 2.3 at the end of May 2024, up from 1.3 in May 2023. The number of months of inventory is the number of months it would take to sell current inventories at the current rate of sales activity.

(SOURCE: OREB)

Read

OTTAWA REAL ESTATE - APRIL STATS (2024)

Modest Gains Across Ottawa’s MLS® Market a Sign of Shared Confidence

The number of homes sold through the MLS® System of the Ottawa Real Estate Board (OREB) totaled 1,456 units in April 2024. This was an increase of 8.9% from April 2023.

Home sales were 2% below the five-year average and 6.9% below the 10-year average for the month of April.

On a year-to-date basis, home sales totaled 4,132 units over the first four months of the year — an increase of 11.5% from the same period in 2023.

“It’s a typical spring in Ottawa’s real estate market,” says OREB President Curtis Fillier. “What sets it apart from recent springs is a restored mutual confidence among both buyers and sellers. Buoyed by recent sales activity, sellers are more confident that they can move their property as evidenced by the uptick in listings. For buyers, the pressure of the pandemic market has eased and they’re comfortable taking the time to find the property that best suits their needs. The pace is still conservative while the economy is holding some back, but overall Ottawa’s market is strong and stable, and that’s a win-win.”

“The real story is in the details,” says Fillier. “Looking more closely at what’s selling and for how much suggests the demographic of buyer is changing. While most of Ottawa’s market is in balanced territory, townhomes have shifted to the seller’s market side as supply shrinks. Single-family homes are the most active market, which is inflating the average sale price. The next few months will be both telling and interesting as people continue to redefine their post-pandemic normal amid an upcoming federal election and back-to-work mandate for government workers. The detailed insights and data that REALTORS® have unique access to will be invaluable in helping buyers fine-tune their strategy for their specific neighbourhood and property type.”

By the Numbers – Prices:
The MLS® Home Price Index (HPI) tracks price trends far more accurately than is possible using average or median price measures.

  • The overall MLS® HPI composite benchmark price was $643,700 in April 2024, a marginal gain of 1.6% from April 2023.

    • The benchmark price for single-family homes was $727,700, up 1.6% on a year-over-year basis in April.

    • By comparison, the benchmark price for a townhouse/row unit was $500,800, up slightly at 1% compared to a year earlier.

    • The benchmark apartment price was $423,100, up 2.1% from year-ago levels.

  • The average price of homes sold in April 2024 was $705,117 increasing 1.2% from April 2023. The more comprehensive year-to-date average price was $675,817, increasing by 2.4% from the first four months of 2023.

  • • The dollar volume of all home sales in April 2024 was $1.02 billion, up 10.2% from the same month in 2023.

OREB cautions that the average sale price can be useful in establishing trends over time but should not be used as an indicator that specific properties have increased or decreased in value. The calculation of the average sale price is based on the total dollar volume of all properties sold. Prices will vary from neighbourhood to neighbourhood.

By the Numbers – Inventory & New Listings

  • The number of new listings saw an increase of 40.5% from April 2023. There were 2,597 new residential listings in April 2024. New listings were 19.7% above the five-year average and 4.6% above the 10-year average for the month of April.

  • Active residential listings numbered 2,966 units on the market at the end of April 2024, a gain of 36.6% from April 2023. Active listings were 62.6% above the five-year average and 13.7% below the 10-year average for the month of April.

  • Months of inventory numbered 2 at the end of April 2024, up only slightly from 1.6 in April 2023. The number of months of inventory is the number of months it would take to sell current inventories at the current rate of sales activity.

(SOURCE: OREB)

Read

OTTAWA REAL ESTATE - MARCH STATS (2024)

Ottawa MLS® Market Shows Early Signs of a Buzzing Spring Market

The number of homes sold through the MLS® System of the Ottawa Real Estate Board totaled 1,165 units in March 2024. This was an increase of 10% from March 2023.

Home sales were 21.5% below the five-year average and 15% below the 10-year average for the month of March.

On a year-to-date basis, home sales totaled 2,678 units over the first three months of the year — an increase of 13.1% from the same period in 2023.

“Ottawa’s real estate market is overall healthy, providing fertile ground for an active spring and summer ahead,” says OREB President Curtis Fillier. “The increases in new and active listings indicate that sellers are feeling more confident, boosted by the rise in showing activity. Buyers, however, aren’t acting as quickly as they perhaps should be — likely because affordability and supply are still roadblocks.”

“Something is around the corner in this market, though,” says Fillier. “People have adjusted to post-pandemic life and that means revisiting their housing needs. Some are downsizing or moving in from the city’s outskirts. Others are looking at more suitable properties that better meet all their needs, which weren’t accessible to them in the peak pandemic market. That’s creating pressure from multiple angles on the mid-range property market, which we know is tight to begin with in Ottawa. Just because you’re in the real estate market, doesn’t mean you’re safe from the market. If you’re a buyer or seller looking to make a move, I wouldn’t wait too long.”

By the Numbers – Prices:

The MLS® Home Price Index (HPI) tracks price trends far more accurately than is possible using average or median price measures.

  • The overall MLS® HPI composite benchmark price was $636,700 in March 2024, a gain of 2.7% from March 2023.

    • The benchmark price for single-family homes was $719,000, up 2.6% on a year-over-year basis in March.

    • By comparison, the benchmark price for a townhouse/row unit was $489,800, up slightly at 0.9% compared to a year earlier.

    • The benchmark apartment price was $423,200, up 4.3% from year-ago levels.

  • The average price of homes sold in March 2024 was $682,078 increasing 5.1% from March 2023. The more comprehensive year-to-date average price was $659,828, increasing by 3.2% from the first three months of 2023.

  • The dollar volume of all home sales in March 2024 was $794.6 million, up 15.6% from the same month in 2023.

OREB cautions that the average sale price can be useful in establishing trends over time but should not be used as an indicator that specific properties have increased or decreased in value. The calculation of the average sale price is based on the total dollar volume of all properties sold. Prices will vary from neighbourhood to neighbourhood.

By the Numbers – Inventory & New Listings

  • The number of new listings saw an increase of 13.5% from March 2023. There were 2,074 new residential listings in March 2024. New listings were 2.3% below the five-year average and 11.1% below the 10-year average for the month of March.

  • Active residential listings numbered 2,543 units on the market at the end of March 2024, a gain of 18.3% from March 2023. Active listings were 58.6% above the five-year average and 17.7% below the 10-year average for the month of March. Active listings haven’t been this high in the month of March in more than five years.

  • Months of inventory numbered 2.2 at the end of March 2024, up only slight from 2 in March 2023 and below the long-run average of 2.6 months for this time of year. The number of months of inventory is the number of months it would take to sell current inventories at the current rate of sales activity.

(SOURCE: OREB)

Read

OTTAWA REAL ESTATE - FEBRUARY STATS (2024)

Ottawa’s MLS® Market Activity Shows Strong Start to the Year

The number of homes sold through the MLS® System of the Ottawa Real Estate Board totaled 886 units in February 2024. This was an increase of 15.2% from February 2023.

Home sales were 13.8% below the five-year average and 5.7% below the 10-year average for the month of February.

“Even with higher prices and the interest rate holding steady, Ottawa is a strong, active market,” says OREB President Curtis Fillier. “With metrics across the board up from last year, it’s clear both buyers and sellers are making moves. The metrics, however, don’t tell us about all the people relegated to the sidelines because affordability remains out of reach for many.”

The Municipal Property Assessment Corporation (MPAC) recently reported that “communities with homes under $500,000 are becoming increasingly scarce.” A decade ago, 74% of Ontario residential properties had a home value estimate of less than $500,000 but that number has dropped to just 19% today.

“REALTORS® know firsthand there is persistent demand for housing in Ottawa, and our market’s activity is constrained by a lack of affordable and suitable supply,” says Fillier. “That’s why we’re currently advocating for impactful measures such as allowing four residential units on property lots and getting rid of exclusionary zoning. There’s a missing middle that we need to build up.”

By the Numbers – Prices:

The MLS® Home Price Index (HPI) tracks price trends far more accurately than is possible using average or median price measures.

  • The overall MLS® HPI composite benchmark price was $628,500 in February 2024, a gain of 2.8% from February 2023.

    • The benchmark price for single-family homes was $708,500, up 3.1% on a year-over-year basis in February.

    • By comparison, the benchmark price for a townhouse/row unit was $495,000, up slightly at 0.6% compared to a year earlier.

    • The benchmark apartment price was $417,000, up 2.7% from year-ago levels.

  • The average price of homes sold in February 2024 was $651,340, increasing 2% from February 2023.

  • The dollar volume of all home sales in February 2024 was $577 million, up 17.5% from the same month in 2023.

OREB cautions that the average sale price can be useful in establishing trends over time but should not be used as an indicator that specific properties have increased or decreased in value. The calculation of the average sale price is based on the total dollar volume of all properties sold. Prices will vary from neighbourhood to neighbourhood.

By the Numbers – Inventory & New Listings

  • The number of new listings saw an increase of 29.5% from February 2023. There were 1,539 new residential listings in February 2024. New listings were 10.3% above the five-year average and 3.3% below the 10-year average for the month of February.

  • Active residential listings numbered 2,158 units on the market at the end of February 2024, a gain of 16.3% from February 2023. Active listings were 59.6% above the five-year average and 17.7% below the 10-year average for the month of February.

  • Months of inventory numbered 2.4 at the end of February 2024, unchanged from February 2023. The number of months of inventory is the number of months it would take to sell current inventories at the current rate of sales activity.

(SOURCE: OREB)

Read

OTTAWA REAL ESTATE - JANUARY STATS (2024)

Ottawa’s MLS® Market Thawed in January but Sales Still Slow

The number of homes sold through the MLS® System of the Ottawa Real Estate Board totaled 629 units in January 2024. This was an increase of 16.5% from January 2023.

Home sales were 10.7% below the five-year average and 3.9% below the 10-year average for the month of January.

“Ottawa’s market activity is seeing positive gains over last year but it’s still a relatively quiet market even by pre-pandemic standards,” says OREB President Curtis Fillier. “While REALTORS® are telling us there’s lots of showing activity — probably thanks in part to the forgiving winter thus far — it’s not all translating to sales. This tells us that buyers are back out there looking, but still approaching cautiously. During the pandemic market, buyers had to move quickly and sometimes settle for a property that didn’t check all their boxes. Today, buyers are using the slower market to take the time needed to find their perfect place. Sellers would be well-advised to adjust their expectations and thoughtfully consider their pricing and timing strategy using the negotiating expertise and hyper-local data their REALTOR® can provide.”

“Ottawa’s market conditions can fluctuate quickly, though, because our supply is chronically low,” adds Brandon Reay, OREB’s policy and external relations manager. “Ottawa needs more suitable and affordable homes to address the housing crisis, and we need to increase density to meet population demands. We can’t restore and grow upon the market activity Ottawa saw five and ten years ago without more houses for people to buy. OREB recommends direct solutions for meaningful policy change, including streamlining the process at the Ontario Land Tribunal, eliminating exclusionary zoning, and permitting four units on residential lots. To meet the aggressive housing targets, we need to close the labour gap with investments in colleges and trade schools. We don’t need any more reactionary and distracting policy, like the federal government’s extension of the foreign buyers ban.”

By the Numbers – Prices:

The MLS® Home Price Index (HPI) tracks price trends far more accurately than is possible using average or median price measures.

  • The overall MLS® HPI composite benchmark price was $621,600 in January 2024, a gain of 3.2% from January 2023.

    • The benchmark price for single-family homes was $703,500, up 3.7% on a year-over-year basis in January.

    • By comparison, the benchmark price for a townhouse/row unit was $462,200, down 2.1% compared to a year earlier.

    • The benchmark apartment price was $418,500, up 3.7% from year-ago levels.

  • The average price of homes sold in January 2024 was $631,722, increasing 1.8% from January 2023.

  • The dollar volume of all home sales in January 2024 was $397.3 million, up 18.6% from the same month in 2023.

OREB cautions that the average sale price can be useful in establishing trends over time but should not be used as an indicator that specific properties have increased or decreased in value. The calculation of the average sale price is based on the total dollar volume of all properties sold. Price will vary from neighbourhood to neighbourhood.

By the Numbers – Inventory & New Listings

  • The number of new listings saw an increase of 7.3% from January 2023. There were 1,271 new residential listings in January 2024. New listings were 17.5% above the five-year average and 0.8% above the 10-year average for the month of January.

  • Active residential listings numbered 1,961 units on the market at the end of January 2024, a gain of 4.5% from the end of January 2023.

  • Active listings were 57.4% above the five-year average and 16.6% below the 10-year average for the month of January. Months of inventory numbered 3.1 at the end of January 2024, down from the 3.5 months recorded at the end of January 2023. The number of months of inventory is the number of months it would take to sell current inventories at the current rate of sales activity.

(SOURCE: OREB)

Read
The trademarks REALTOR®, REALTORS®, and the REALTOR® logo are controlled by The Canadian Real Estate Association (CREA) and identify real estate professionals who are member’s of CREA. The trademarks MLS®, Multiple Listing Service® and the associated logos are owned by CREA and identify the quality of services provided by real estate professionals who are members of CREA. Used under license.